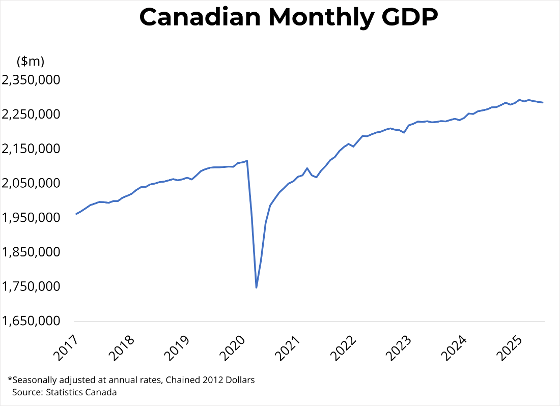
Canadian real GDP fell by 0.1 per cent in June, after declining by 0.1 per cent in May. Goods-producing sectors fell 0.5 per cent, while service-producing industries increased by 0.1 per cent. Sectoral growth was led by retail trade (1.4 per cent), wholesale trade (0.5 per cent), and construction (0.3 per cent). The biggest detractors from growth were from manufacturing (-1.5 per cent) and utilities (-1.2 per cent). Output for the offices of real-estate agents and brokers rose by 3.1 per cent month-over-month. Preliminary estimates suggest that real GDP by industry increased by 0.1 per cent in July.

Real GDP declined by 0.4 per cent in the second quarter of 2025, registering an annualized growth rate of -1.6 per cent. Contraction was driven by a broad-based slowdown in trade, with exports and imports falling by 7.5 per cent and 1.3 per cent, respectively. Business investment fell by 0.6 per cent, driven by slower investment in machinery and equipment (-9.4 per cent).  Meanwhile, slightly higher investment in residential structures (1.5 per cent) was offset by its non-residential counterpart (-3.3 per cent). Household spending rose 1.1 per cent in the second quarter, while the household savings rate fell a full point to 5.0 per cent, driven by weakening income growth. On a per capita basis, GDP fell 0.4 per cent in Q2 after increasing by 0.4 per cent in the previous quarter.

As many feared, the consequences of tariffs on the Canadian economy are reflected in this print, with Q2 GDP growth falling below the Bank of Canada's most recent projection. Contraction is largely attributable to far lower trade, offsetting the export growth which propelled the economy forward during Q1 as companies tried to get ahead of tariffs. Moreover, the associated uncertainty of volatile trade policy hampered investment from Canadian businesses, creating a further drag on growth.  This report could influence the Bank of Canada towards a rate cut during their next meeting in hopes of re-igniting the economy moving into the fall. Moving forward, the Bank of Canada will closely watch next month's inflation data for signs that core inflation is moderating to its 2% target, such that it can more confidently commit to a 25-point cut in September.

For more information regarding British Columbia's GDP growth, please visit our Nowcast for an estimate of economic activity throughout the province:

https://infogram.com/1pd36dxvpnw629umvzqqzd69rrskqe1dm5k

For more information, please contact: Gino Pezzani.

https://mailchi.mp/bcrea/canadian-economic-growth-real-gdp-q2-2025

Read

To view the full interactive BCREA Commercial Leading Indicator, click here.
To view the full Commercial Leading Indicator PDF, click here.  

The BCREA Commercial Leading Indicator (CLI) fell 0.3 points to 152.4 in the second quarter of 2025, while the six-month moving average rose to 152.5. Compared to the same quarter in 2024, the index was up 2.9 per cent. 

Second Quarter Highlights:

  • The economic activity index fell in Q2 by 0.9 points. Contraction in this index was driven by lower inflation-adjusted wholesale trade (-5.1 per cent) and manufacturing sales (-4.5 per cent), which offset growth from retail sales (2.0 per cent).

  • The overall employment component increased by 0.5 points in the second quarter. Growth in office employment (2.3 per cent) offset a modest fall in manufacturing employment (-0.5 per cent), suggesting a steady level of job creation through the first half of the year.

  • The financial component of the index increased in the second quarter by 0.3 points. Real Estate Investment Trust (REIT) prices rose by 6.4 per cent, pushing the component up. Additionally, interest rate spreads remained virtually unchanged from the previous quarter, indicating a similar level of short-term risk in the economy.

For more information, please contact: Gino Pezzani.

 
Read

About BCREA’s Housing Monitor Dashboard

The BCREA Economics team has created the Housing Monitor Dashboard to help REALTORS® monitor BC’s housing market. This dashboard, which is updated monthly, provides up-to-date data on key variables for public education and use. Focuses include: 

  • Resale Home Market

  • Construction

  • Rental Market

  • Borrowing Costs

  • Other BCREA Data

In the dashboard, the image and data are available for download under each chart, where possible.

For more information, please contact: Gino Pezzani.

 
Read

Canadian prices, as measured by the Consumer Price Index (CPI), rose 1.7 per cent on a year-over-year basis in July, down from a 1.9 per cent increase in June. Month-over-month, on a seasonally adjusted basis, the CPI was up 0.1 per cent in July. Downward pressure on headline inflation was driven by a sharper fall in gasoline prices year-over-year compared to June. The CPI ex-gasoline has held at 2.5 per cent over the past three months.  Additionally, shelter price growth rose for the first time since February 2024, with prices growing by 3.0 per cent in July, slightly up from 2.9 per cent in June. Food purchased in grocery stores rose at a faster pace of 3.4 per cent year-over-year compared to 2.8 per cent the previous month. In BC, consumer prices rose 1.7 per cent year-over-year in July, down from 2.1 per cent in June. The Bank of Canada's preferred measures of median and trimmed inflation, which strip out volatile components, are 3.1 per cent and 3.0 per cent year-over-year, respectively.

July's CPI report continues to show a divergence between headline and core inflation, largely due to monthly fluctuations in energy prices. The Bank of Canada's core measures of inflation have remained at the upper end—and even outside of—their target range for the past three months as tariffs continue passing through the economy. With 3-month annualized core inflation dropping a full point to 2.4 per cent, this report slightly favours a rate cut from the Bank of Canada in September, as the downside risks to growth remain strong from ongoing trade uncertainties. 

https://mailchi.mp/bcrea/canadian-inflation-july-2025

For more information, please contact: Gino Pezzani.

Read

Canadian housing starts increased 4 per cent from the previous month, totalling 294,085 units in July at a seasonally adjusted annual rate (SAAR). Starts were up 7 per cent from the same month last year. Single-detached housing starts decreased by 1 per cent from last month to 55,740 units, while multi-family and other starts increased by 5 per cent to 238,342 units (SAAR).

In British Columbia, starts fell by 15 per cent from last month to 56,918 units (SAAR) in all areas of the province. In areas of the province with 10,000 or more residents, single-detached starts increased by 1 per cent to 3,953 units, while multi-family starts fell by 17 per cent to 50,394 units month-over-monthStarts in the province were 16 per cent above the levels from July 2024. Year-to-date starts are up 147 per cent in Abbotsford and 29 per cent in Victoria, but down 71 per cent in Nanaimo, 36 per cent in Kelowna, and 5 per cent in Vancouver. 

https://mailchi.mp/bcrea/canadian-housing-starts-july-2025

For more information, please contact: Gino Pezzani.

Read

For the complete news release, including detailed statistics, click here.

ancouver, BC – August 2025. The British Columbia Real Estate Association (BCREA) reports that 7,056 residential unit sales were recorded in Multiple Listing Service® (MLS®) Systems in July 2025, up 2.2 per cent from July 2024. The average MLS® residential price in BC in July 2025 was down 2.1 per cent at $942,686 compared to $963,047 in July 2024.

The total sales dollar volume was $6.7 billion, virtually unchanged from the same time the previous year. BC MLS® unit sales were 16 per cent lower than the ten-year July average.
 
“Housing markets across BC continue to build momentum through the summer, with all regions apart from the Lower Mainland boasting higher sales activity from the previous year,” said BCREA Chief Economist Brendon Ogmundson. “With a stable trajectory for monetary policy, we expect sales in the province will continue to improve as tariff uncertainties fade.”
 
Year-to-date, BC residential sales dollar volume is down 9.4 per cent to $40.8 billion, compared with the same period in 2024. Residential unit sales are down 5.7 per cent year-over-year at 42,895 units, while the average MLS® residential price is also down 3.9 per cent to $952,323.

For more information, please contact: Gino Pezzani.

Read
Categories:   Albion, Maple Ridge Real Estate | April 2023 Newsletter | April 2024 Newsletter | April 2025 Newsletter | April Newsletter 2022 | Arbutus, Vancouver West Real Estate | August 2021 News | August 2022 Newsletter | August 2023 Newsletters | August 2024 Newsletter | August 2025 Newsletter | Bank | Blueridge NV, North Vancouver Real Estate | Brentwood Park, Burnaby North Real Estate | Brighouse South, Richmond Real Estate | Brighouse, Richmond Real Estate | British Properties, West Vancouver Real Estate | Burke Mountain, Coquitlam Real Estate | Burnaby Lake, Burnaby South Real Estate | Cambie, Vancouver West Real Estate | Canadian Employment | Canadian Inflation | Canyon Heights NV, North Vancouver Real Estate | Canyon Springs, Coquitlam Real Estate | Capitol Hill BN, Burnaby North Real Estate | Central Lonsdale, North Vancouver Real Estate | Central Park BS, Burnaby South Real Estate | Champlain Heights, Vancouver East Real Estate | Citadel PQ, Port Coquitlam Real Estate | Cloverdale BC, Cloverdale Real Estate | Coal Harbour, Vancouver West Real Estate | Collingwood VE, Vancouver East Real Estate | Coquitlam West, Coquitlam Real Estate | COVID-19 Recovery Dashboard | December 2021 Newsletter | December 2022 Newsletter | December 2023 Newsletter | December 2024 Newsletter | Delta Manor, Ladner Real Estate | Downtown NW, New Westminster Real Estate | Downtown VW, Vancouver West Real Estate | Downtown, Vancouver West Real Estate | Dunbar, Vancouver West Real Estate | Eagle Harbour, West Vancouver Real Estate | East Burnaby, Burnaby East Real Estate | East Newton, Surrey Real Estate | East Richmond, Richmond Real Estate | Fairview VW, Vancouver West Real Estate | False Creek, Vancouver West Real Estate | February Newsletter 2022 | February Newsletter 2023 | February Newsletter 2024 | February Newsletter 2025 | Forest Hills BN, Burnaby North Real Estate | Fraser VE, Vancouver East Real Estate | Fraserview NW, New Westminster Real Estate | Fraserview VE, Vancouver East Real Estate | GDP | Grandview VE, Vancouver East Real Estate | Grandview Woodland, Vancouver East Real Estate | Greentree Village, Burnaby South Real Estate | Hamilton RI, Richmond Real Estate | Hamilton, Richmond Real Estate | Hastings, Vancouver East Real Estate | Highgate, Burnaby South Real Estate | House Marketing | Housing Starts | Interest Rate | Ironwood, Richmond Real Estate | January Newsletter 2022 | January Newsletter 2023 | January Newsletter 2024 | January Newsletter 2025 | July 2021 Newsletter | July 2022 Newsletter | July 2023 Newsletter | July 2024 Newsletter | July 2025 Newsletter | June 2022 Newsletter | June 2023 Newsletter | June 2024 Newsletter | June 2025 Newsletter | Killarney VE, Vancouver East Real Estate | Kitsilano, Vancouver West Real Estate | Knight, Vancouver East Real Estate | Letter From The Heart | Lions Bay, West Vancouver Real Estate | Lower Lonsdale, North Vancouver Real Estate | Maillardville, Coquitlam Real Estate | Main, Vancouver East Real Estate | March Newsletter 2022 | March Newsletter 2023 | March Newsletter 2024 | March Newsletter 2025 | May 2022 Newsletter | May 2023 Newsletter | May 2024 Newsletter | May 2025 Newsletter | Meadow Brook, Coquitlam Real Estate | Metrotown, Burnaby South Real Estate | Mount Pleasant VE, Vancouver East Real Estate | Mount Pleasant VW, Vancouver West Real Estate | New Horizons, Coquitlam Real Estate | Newsletter November 2021 | North Coquitlam, Coquitlam Real Estate | North Vancouver Real Estate | November 2021 Newsletter | November 2022 Newsletter | November 2023 Newsletter | November 2024 Newsletter | November Newsletter 2021 | October 2021 Newsletter | October 2022 Newsletter | October 2023 Newsletter | October 2024 Newsletter | Pebble Hill, Tsawwassen Real Estate | Pictures and thoughts to share | Point Grey, Vancouver West Real Estate | Quay, New Westminster Real Estate | Queen Mary Park Surrey, Surrey Real Estate | Queensborough, New Westminster Real Estate | Quilchena, Vancouver West Real Estate | Richmond Real Estate | S.W. Marine, Vancouver West Real Estate | Sapperton, New Westminster Real Estate | September 2021 News | September 2022 Newsletter | September 2023 Newsletter | September 2024 Newsletters | september 2025 Newsletter | Silver Valley, Maple Ridge Real Estate | Simon Fraser Univer., Burnaby North Real Estate | Sold listings | South Granville, Vancouver West Real Estate | South Marine, Vancouver East Real Estate | South Slope, Burnaby South Real Estate | South Surrey White Rock Real Estate | Squamish Real Estate | Steveston South, Richmond Real Estate | Sullivan Heights, Burnaby North Real Estate | The Crest, Burnaby East Real Estate | Tsawwassen Central, Tsawwassen Real Estate | University VW, Vancouver West Real Estate | Upper Eagle Ridge, Coquitlam Real Estate | Uptown NW, New Westminster Real Estate | vancouver island Real Estate | Vancouver Real Estate | Victoria VE, Vancouver East Real Estate | Victoria VE, Vancouver West Real Estate | WALL CENTRE FALSE CREEK, Vancouver West Real Estate | West End VW, Vancouver West Real Estate | Westwood Plateau, Coquitlam Real Estate | Whalley, North Surrey Real Estate | Whalley, Surrey Real Estate | Willoughby Heights, Langley Real Estate | Yale - Dogwood Valley, Vancouver West Real Estate | Yaletown, Vancouver West Real Estate | Yel | Yelllow Newsletter July 2022 | Yellow Newletter December 2021 | Yellow Newletter June 2022 | Yellow Newsletter | Yellow Newsletter April 2022 | Yellow Newsletter April 2023 | Yellow Newsletter April 2024 | Yellow Newsletter April 2025 | Yellow Newsletter August 2021 | Yellow Newsletter August 2022 | Yellow Newsletter August 2023 | Yellow Newsletter August 2024 | Yellow Newsletter August 2025 | Yellow Newsletter December 2021 | Yellow Newsletter December 2022 | Yellow Newsletter December 2023 | Yellow Newsletter December 2024 | Yellow Newsletter February 2022 | Yellow Newsletter February 2023 | Yellow Newsletter February 2024 | Yellow Newsletter February 2025 | Yellow Newsletter January 2022 | Yellow Newsletter January 2023 | Yellow Newsletter January 2024 | Yellow Newsletter January 2025 | Yellow Newsletter July 2022 | Yellow Newsletter July 2023 | Yellow Newsletter July 2024 | Yellow Newsletter July 2025 | Yellow Newsletter June 2022 | Yellow Newsletter June 2023 | Yellow Newsletter June 2024 | Yellow Newsletter June 2025 | Yellow Newsletter March 2022 | Yellow Newsletter March 2023 | Yellow Newsletter March 2024 | Yellow Newsletter March 2025 | Yellow Newsletter May 2022 | Yellow Newsletter May 2023 | Yellow Newsletter May 2024 | Yellow Newsletter May 2025 | Yellow Newsletter November 2021 | Yellow Newsletter November 2022 | Yellow Newsletter November 2023 | Yellow Newsletter November 2024 | Yellow Newsletter October 2021 | Yellow Newsletter October 2022 | Yellow Newsletter October 2023 | Yellow Newsletter October 2024 | Yellow Newsletter October, 2021 | Yellow Newsletter September 2021 | Yellow Newsletter September 2022 | Yellow Newsletter September 2023 | Yellow Newsletter September 2024 | Yellow Newsletter September 2025