Posted on
December 4, 2024
by
Gino Pezzani
To view the full interactive BCREA Commercial Leading Indicator, click here.
To view the full Commercial Leading Indicator PDF, click here.
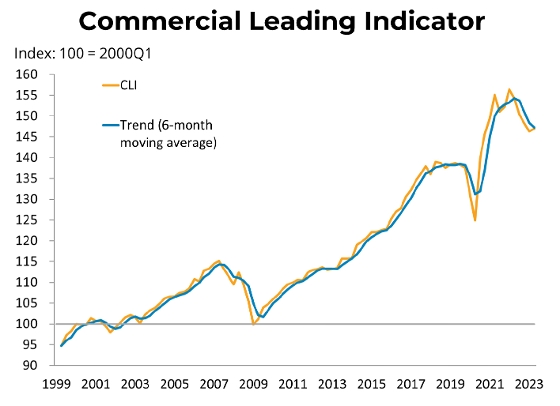
The BCREA Commercial Leading Indicator fell 0.2 points to 145.6 in the third quarter of 2024, while the six-month moving average also fell to 145.7. Compared to the same quarter in 2023, the index was up 0.3 per cent.
Third Quarter Highlights
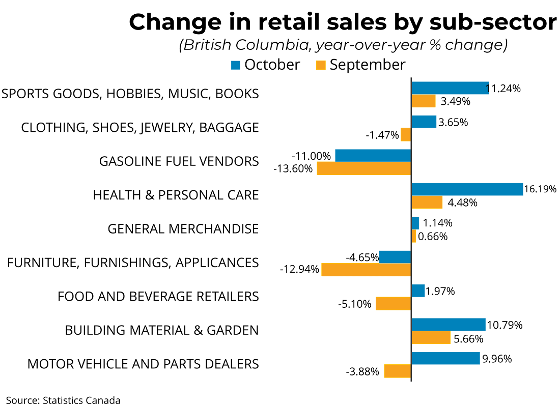
The economic activity index declined in Q3 by 0.2 points. Contraction in this index was broad-based, with inflation-adjusted retail trade (-0.3 per cent), wholesale trade (-0.7 per cent), and manufacturing sales (-0.3 per cent) falling from the previous quarter.
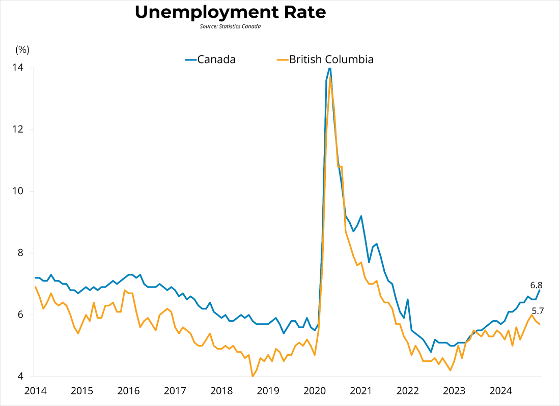
Office employment (financial, insurance, real estate, and professional services) fell by 3.3 per cent in the third quarter, while manufacturing employment increased by 0.8 per cent. The overall employment component declined by 0.6 points from the previous quarter, contributing negatively to the index.
The financial component of the index increased in the third quarter by 0.7 points. Real Estate Investment Trust (REIT) prices rose by 10.2 per cent, pushing the component up. Conversely, interest rate spreads increased from the previous quarter, indicating more perceived short-term risk in the economy. However, this effect only partially offsets the strong increase in REIT prices, leading to a net positive impact on commercial activity for the overall component.
For more information, please contact: Gino Pezzani.
 About BCREA’s Housing Monitor Dashboard
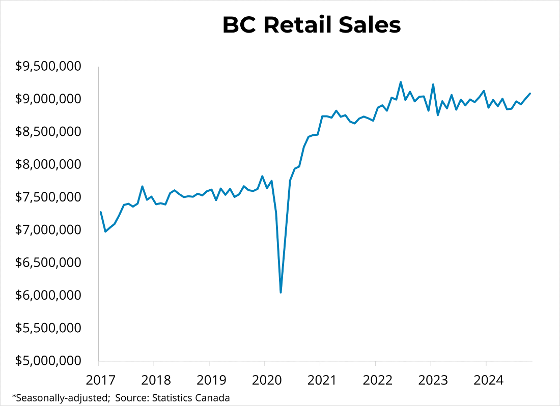


 For more information, please contact: Gino Pezzani.