About BCREA’s Housing Monitor Dashboard

The BCREA Economics team has created the Housing Monitor Dashboard to help REALTORS® monitor BC’s housing market. This dashboard, which is updated monthly, provides up-to-date data on key variables for public education and use. Focuses include: 

  • Resale Home Market

  • Construction

  • Rental Market

  • Borrowing Costs

  • Other BCREA Data

In the dashboard, the image and data are available for download under each chart, where possible.

For more information, please contact: Gino Pezzani.

Read

To view the full interactive BCREA Housing Forecast Update, click here.
To download the PDF, click here.

BCREA 2025 First Quarter Housing Forecast Update

Vancouver, BC – January 2025. The British Columbia Real Estate Association (BCREA) released its 2025 First Quarter Housing Forecast Update today.

Multiple Listing Service® (MLS®) residential sales in BC are forecast to increase 14.3 per cent to 85,140 units this year. In 2026, MLS® residential sales are forecast to strengthen further, rising to 87,670 units.

“Markets across BC closed 2024 with significant momentum,” said BCREA Chief Economist Brendon Ogmundson. “While we are entering 2025 with a high level of optimism and expectations for increased activity, the potential for punishing tariffs on BC exports to the United States presents significant uncertainty for the outlook.”

Although new listings activity has been much stronger than last year, the accumulation of inventory in 2024 had much more to do with a prolonged slump in home sales. With active listings returning to more healthy levels across BC, we expect that the market will be able to absorb the coming rise in sales activity without a sharp increase in prices. Nonetheless, following a year of flat prices, the average price in BC is projected to rise by 4.5 per cent in 2025, driven by a strong recovery in overall housing demand.

For the complete news release, including detailed statistics, click here.

For more information, please contact: Gino Pezzani.


Read

Canadian housing starts fell by 13 per cent to 231,468 units in December at a seasonally adjusted annual rate (SAAR). Starts were down 8 per cent from the same month last year. Single-detached housing starts were 9 per cent lower than last month at 57,626 units, while multi-family and other starts fell by 15 per cent to 173,842 (SAAR).

In British Columbia, starts fell by 8 per cent from last month to 47,137 units SAAR in all areas of the province. In areas of the province with 10,000 or more residents, single-detached starts dropped by 6 per cent to 4,303 units, while multi-family starts dropped by 9 per cent to 41,098 units month-over-month. Starts in the province were 25 per cent below the levels from December 2023. However, this drop-off is largely a base-month effect, as seasonally adjusted starts last December were among the highest levels seen in the past few years. Compared with last year, year-to-date starts were up by 28 per cent in Kelowna, 2 per cent in Abbotsford, and 1 per cent in Nanaimo, while being down by 15 per cent in Vancouver and 16 per cent in Victoria.

https://mailchi.mp/bcrea/canadian-housing-starts-december-2024

For more information, please contact: Gino Pezzani.

Read

Home sales registered on the Multiple Listing Service® (MLS®) in Metro Vancouver rose over thirty per cent in December, compared to the previous year, signalling strengthening demand-side momentum to close out 2024. 

The Greater Vancouver REALTORS® (GVR) reports that residential sales in the region totalled 26,561 in 2024, a 1.2 per cent increase from the 26,249 sales recorded in 2023, and a 9.2 per cent decrease from the 29,261 sales in 2022. 

Last year’s sales total was 20.9 per cent below the 10-year annual sales average (33,559). 

“Looking back on 2024, it could best be described as a pivot year for the market after experiencing such dramatic increases in mortgage rates in the preceding years,” said Andrew Lis, GVR’s director of economics and data analytics. “With borrowing costs now firmly on the decline, buyers have started to show up in numbers after somewhat of a hiatus – and this renewed strength is now clearly visible in the more recent monthly data.” 

Properties listed on the MLS® system in Metro Vancouver totalled 60,388 in 2024. This represents an 18.7 per cent increase compared to the 50,894 properties listed in 2023. This was 9.7 per cent above the 55,047 properties listed in 2022. 

The total number of properties listed last year was 5.7 per cent above the region’s 10-year annual average (57,136). 

Currently, the total number of homes listed for sale on the MLS® system in Metro Vancouver is 10,948, a 24.4 per cent increase compared to December 2024 (8,802). This total is also 25.3 per cent above the 10-year seasonal average (8,737). 

The MLS® Home Price Index composite benchmark price for all residential properties in Metro Vancouver is currently $1,171,500. This represents a 0.5 per cent increase over December 2023 and a 0.1 per cent decrease compared to November 2024. 

“Disappointingly, sales came in shy of our forecasted target for the year, but the December figures signal an emerging pattern of strength in home sales, building on the momentum seen in previous months,” Lis said. “These more recent sales figures are now trending back towards long-term historical averages, which suggests there may still be quite a bit of potential upside for sales as we head into 2025, should the recent strength continue. 

“Although sales activity had a slower start to the year, price trends began 2024 on the rise and closed out the year on a flatter trajectory. Most market segments saw year-over-year increases of a few per cent except for apartment units, which ended 2024 roughly flat. With the data showing renewed strength to finish the year however, it looks as though the 2025 market is positioned to be considerably more active than we’ve seen in recent years.”  

December 2024 summary 

Residential sales in the region totalled 1,765 in December 2024, a 31.2 per cent increase from the 1,345 sales recorded in December 2023. This was 14.9 per cent below the 10-year seasonal average (2,074) for the month. 

There were 1,676 detached, attached and apartment properties newly listed for sale on the MLS® system in Metro Vancouver in December 2024. This represents a 26.3 per cent increase compared to the 1,327 properties listed in December 2023. This was 1.1 per cent below the 10-year seasonal average (1,695). 

Across all detached, attached and apartment property types, the sales-to-active listings ratio for December 2024 is 16.8 per cent. By property type, the ratio is 12.1 per cent for detached homes, 23.6 per cent for attached, and 18.7 per cent for apartments. 

Analysis of the historical data suggests downward pressure on home prices occurs when the ratio dips below 12 per cent for a sustained period, while home prices often experience upward pressure when it surpasses 20 per cent over several months. 

Sales of detached homes in December 2024 reached 494, a 31.4 per cent increase from the 376 detached sales recorded in December 2023. The benchmark price for a detached home is $1,997,000. This represents a two per cent increase from December 2023 and is nearly unchanged compared to November 2024. 

Sales of apartment homes reached 891 in December 2024, a 23.9 per cent increase compared to the 719 sales in December 2023. The benchmark price of an apartment home is $749,900. This represents a 0.1 per cent decrease from December 2023 and a 0.4 per cent decrease compared to November 2024. 

Attached home sales in December 2024 totalled 371, a 55.9 per cent increase compared to the 238 sales in December 2023. The benchmark price of a townhouse is $1,114,600. This represents a 3.4 per cent increase from December 2023 and a 0.3 per cent decrease compared to November 2024. 

Download the GVR 2024 year-end residential market report

For more information, please contact: Gino Pezzani.

Read

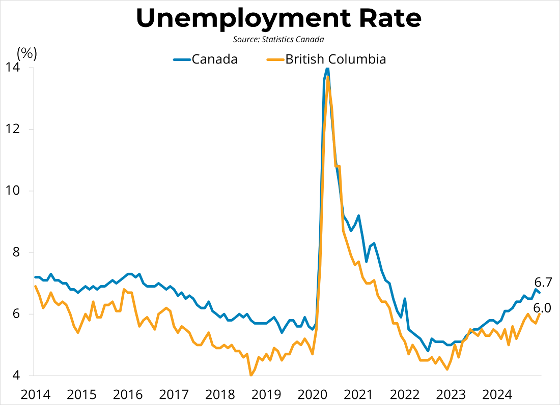
Canadian employment rose by 0.4 per cent from the previous month, growing by 91,000 jobs to 20.738 million in December. The employment rate rose by 0.2 points to 60.8 per cent, while the unemployment rate fell 0.1 points to 6.7 per cent. Average hourly wages rose 3.8 per cent year-over-year to $35.77 last month, while total hours worked were up 2.1 per cent from December of the previous year.

Employment in B.C. rose by 0.5 per cent to 2.844 million, with a gain of 14,000 jobs in December. Employment in Metro Vancouver fell 0.1 per cent to 1.601 million in December. The unemployment rate in B.C. rose by 0.3 points to 6.0 per cent in December. Meanwhile, Vancouver's unemployment rate rose by 0.2 points to 6.5 per cent in the final month of the year. Overall, British Columbia's labour statistics are very weak and have diverged from national patterns, with employment only 0.2 per cent higher than December 2023.

December's jobs data shows a second consecutive month of strong employment growth, while the unemployment rate remains stable, though at a higher-than-desired level. Job growth was more broad-based than in previous months, with 12 out of 16 measured industries finding employment gains. December's report closes the year on a strong note and may signal the onset of an expected economic recovery in 2025. We continue to anticipate that the Bank of Canada will lower its policy rate two more times over the first half of 2025 before pausing to assess the need for further stimulus. 

https://mailchi.mp/bcrea/canadian-employment-december-2024

For more information, please contact: Gino Pezzani.

Read

As of January 1, 2025, the BC Home Flipping Tax is now in effect. This new tax is distinct from the existing federal property flipping tax and specifically targets short-term property sales within British Columbia. 

Here’s how it works: 

  • The tax applies to income from sales of residential properties, presale contracts, or assignments owned for less than 730 days (two years). This includes properties bought before January 1, 2025, if they are sold on or after that date and owned for less than two years.  

  • The rate is 20 per cent for sales within the first 365 days of ownership, gradually decreasing until it is eliminated at 730 days.  

  • This tax applies to any person or entity (individual, corporation, partnership, or trust) selling property within BC, regardless of residency.  

  • Exemptions include certain primary residences, though exemptions are subject to specific conditions and filing requirements. 

The BC Government has released a new video about the tax. Check it out below.

To check out all the details on the BC Government website, click here.

For the BC Real Estate Association’s breakdown of the new tax, including a comparison with the federal flipping tax, click here.  

For more information, please contact: Gino Pezzani.
Read
Categories:   Albion, Maple Ridge Real Estate | April 2023 Newsletter | April 2024 Newsletter | April 2025 Newsletter | April Newsletter 2022 | Arbutus, Vancouver West Real Estate | August 2021 News | August 2022 Newsletter | August 2023 Newsletters | August 2024 Newsletter | Bank | Blueridge NV, North Vancouver Real Estate | Brentwood Park, Burnaby North Real Estate | Brighouse South, Richmond Real Estate | Brighouse, Richmond Real Estate | British Properties, West Vancouver Real Estate | Burke Mountain, Coquitlam Real Estate | Burnaby Lake, Burnaby South Real Estate | Cambie, Vancouver West Real Estate | Canadian Employment | Canadian Inflation | Canyon Heights NV, North Vancouver Real Estate | Canyon Springs, Coquitlam Real Estate | Capitol Hill BN, Burnaby North Real Estate | Central Lonsdale, North Vancouver Real Estate | Central Park BS, Burnaby South Real Estate | Champlain Heights, Vancouver East Real Estate | Citadel PQ, Port Coquitlam Real Estate | Cloverdale BC, Cloverdale Real Estate | Coal Harbour, Vancouver West Real Estate | Collingwood VE, Vancouver East Real Estate | Coquitlam West, Coquitlam Real Estate | COVID-19 Recovery Dashboard | December 2021 Newsletter | December 2022 Newsletter | December 2023 Newsletter | December 2024 Newsletter | Delta Manor, Ladner Real Estate | Downtown NW, New Westminster Real Estate | Downtown VW, Vancouver West Real Estate | Downtown, Vancouver West Real Estate | Dunbar, Vancouver West Real Estate | Eagle Harbour, West Vancouver Real Estate | East Burnaby, Burnaby East Real Estate | East Newton, Surrey Real Estate | East Richmond, Richmond Real Estate | Fairview VW, Vancouver West Real Estate | False Creek, Vancouver West Real Estate | February Newsletter 2022 | February Newsletter 2023 | February Newsletter 2024 | February Newsletter 2025 | Forest Hills BN, Burnaby North Real Estate | Fraser VE, Vancouver East Real Estate | Fraserview NW, New Westminster Real Estate | Fraserview VE, Vancouver East Real Estate | GDP | Grandview VE, Vancouver East Real Estate | Grandview Woodland, Vancouver East Real Estate | Greentree Village, Burnaby South Real Estate | Hamilton RI, Richmond Real Estate | Hamilton, Richmond Real Estate | Hastings, Vancouver East Real Estate | Highgate, Burnaby South Real Estate | House Marketing | Housing Starts | Interest Rate | Ironwood, Richmond Real Estate | January Newsletter 2022 | January Newsletter 2023 | January Newsletter 2024 | January Newsletter 2025 | July 2021 Newsletter | July 2022 Newsletter | July 2023 Newsletter | July 2024 Newsletter | June 2022 Newsletter | June 2023 Newsletter | June 2024 Newsletter | Killarney VE, Vancouver East Real Estate | Kitsilano, Vancouver West Real Estate | Knight, Vancouver East Real Estate | Letter From The Heart | Lions Bay, West Vancouver Real Estate | Lower Lonsdale, North Vancouver Real Estate | Maillardville, Coquitlam Real Estate | Main, Vancouver East Real Estate | March Newsletter 2022 | March Newsletter 2023 | March Newsletter 2024 | March Newsletter 2025 | May 2022 Newsletter | May 2023 Newsletter | May 2024 Newsletter | Meadow Brook, Coquitlam Real Estate | Metrotown, Burnaby South Real Estate | Mount Pleasant VE, Vancouver East Real Estate | Mount Pleasant VW, Vancouver West Real Estate | New Horizons, Coquitlam Real Estate | Newsletter November 2021 | North Coquitlam, Coquitlam Real Estate | North Vancouver Real Estate | November 2021 Newsletter | November 2022 Newsletter | November 2023 Newsletter | November 2024 Newsletter | November Newsletter 2021 | October 2021 Newsletter | October 2022 Newsletter | October 2023 Newsletter | October 2024 Newsletter | Pebble Hill, Tsawwassen Real Estate | Pictures and thoughts to share | Point Grey, Vancouver West Real Estate | Quay, New Westminster Real Estate | Queen Mary Park Surrey, Surrey Real Estate | Queensborough, New Westminster Real Estate | Quilchena, Vancouver West Real Estate | Richmond Real Estate | S.W. Marine, Vancouver West Real Estate | Sapperton, New Westminster Real Estate | September 2021 News | September 2022 Newsletter | September 2023 Newsletter | September 2024 Newsletters | Silver Valley, Maple Ridge Real Estate | Simon Fraser Univer., Burnaby North Real Estate | Sold listings | South Granville, Vancouver West Real Estate | South Marine, Vancouver East Real Estate | South Slope, Burnaby South Real Estate | South Surrey White Rock Real Estate | Squamish Real Estate | Steveston South, Richmond Real Estate | Sullivan Heights, Burnaby North Real Estate | The Crest, Burnaby East Real Estate | Tsawwassen Central, Tsawwassen Real Estate | University VW, Vancouver West Real Estate | Upper Eagle Ridge, Coquitlam Real Estate | Uptown NW, New Westminster Real Estate | vancouver island Real Estate | Vancouver Real Estate | Victoria VE, Vancouver East Real Estate | Victoria VE, Vancouver West Real Estate | WALL CENTRE FALSE CREEK, Vancouver West Real Estate | West End VW, Vancouver West Real Estate | Westwood Plateau, Coquitlam Real Estate | Whalley, North Surrey Real Estate | Whalley, Surrey Real Estate | Willoughby Heights, Langley Real Estate | Yale - Dogwood Valley, Vancouver West Real Estate | Yaletown, Vancouver West Real Estate | Yel | Yelllow Newsletter July 2022 | Yellow Newletter December 2021 | Yellow Newletter June 2022 | Yellow Newsletter | Yellow Newsletter April 2022 | Yellow Newsletter April 2023 | Yellow Newsletter April 2024 | Yellow Newsletter April 2025 | Yellow Newsletter August 2021 | Yellow Newsletter August 2022 | Yellow Newsletter August 2023 | Yellow Newsletter August 2024 | Yellow Newsletter December 2021 | Yellow Newsletter December 2022 | Yellow Newsletter December 2023 | Yellow Newsletter December 2024 | Yellow Newsletter February 2022 | Yellow Newsletter February 2023 | Yellow Newsletter February 2024 | Yellow Newsletter February 2025 | Yellow Newsletter January 2022 | Yellow Newsletter January 2023 | Yellow Newsletter January 2024 | Yellow Newsletter January 2025 | Yellow Newsletter July 2022 | Yellow Newsletter July 2023 | Yellow Newsletter July 2024 | Yellow Newsletter June 2022 | Yellow Newsletter June 2023 | Yellow Newsletter June 2024 | Yellow Newsletter March 2022 | Yellow Newsletter March 2023 | Yellow Newsletter March 2024 | Yellow Newsletter March 2025 | Yellow Newsletter May 2022 | Yellow Newsletter May 2023 | Yellow Newsletter May 2024 | Yellow Newsletter November 2021 | Yellow Newsletter November 2022 | Yellow Newsletter November 2023 | Yellow Newsletter November 2024 | Yellow Newsletter October 2021 | Yellow Newsletter October 2022 | Yellow Newsletter October 2023 | Yellow Newsletter October 2024 | Yellow Newsletter October, 2021 | Yellow Newsletter September 2021 | Yellow Newsletter September 2022 | Yellow Newsletter September 2023 | Yellow Newsletter September 2024