To view the full Commercial Leading Indicator PDF, click here.
In the first quarter of 2023, the BCREA Commercial Leading Indicator (CLI) held steady at 148, while the six-month moving average continued its downward trajectory to 149. Compared to the same quarter in 2022, the index was down by 5 per cent.
It is important to note that the environment for commercial real estate remains highly abnormal and uncertain. The CLI is designed to interpret economic and office employment growth as positive indicators for commercial real estate demand. However, the recent strong growth in these indicators may not translate as readily into improved commercial real estate market conditions due to structural changes in the economy caused by the COVID-19 pandemic. 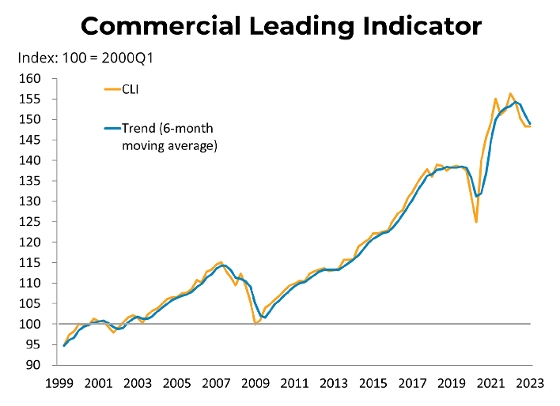
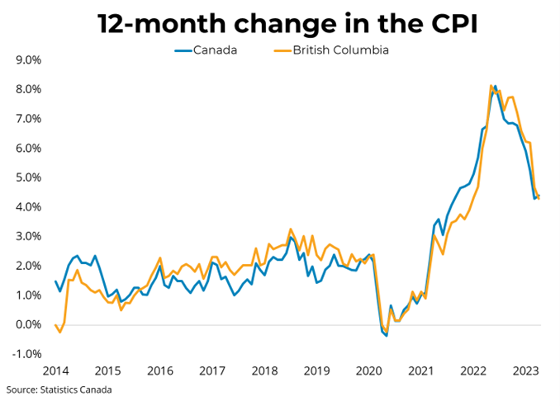
The CLI held steady due to an improvement in the financial component, completely offsetting a decline in employment, while the economic component was essentially unchanged. Spreads between corporate and government borrowing costs declined in the first quarter while Real Estate Investment Trust (REIT) prices rose, strengthening the financial component of the index. In contrast, the employment component of the index fell due to declines in both office employment (finance, insurance, and real estate) as well as manufacturing employment. Finally, the economic component of the index was essentially unchanged as rising wholesale trade was entirely offset by declining inflation-adjusted retail sales and manufacturing sales.
For more information, please contact: Gino Pezzani.
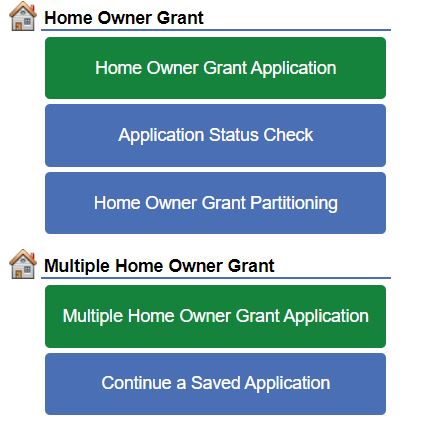 The home owner grant reduces the amount of property tax you pay for your principal residence.
 About BCREA’s Housing Monitor Dashboard
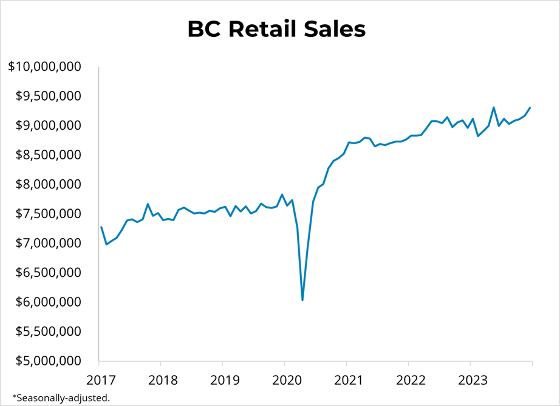


 Link:
Link: