About BCREA’s Housing Monitor Dashboard

The BCREA Economics team has created the Housing Monitor Dashboard to help REALTORS® monitor BC’s housing market. This dashboard, which is updated monthly, provides up-to-date data on key variables for public education and use. Focuses include: 

  • Resale Home Market

  • Construction

  • Rental Market

  • Borrowing Costs

  • Other BCREA Data

In the dashboard, the image and data are available for download under each chart, where possible.

For more information, please contact: Gino Pezzani.

Read

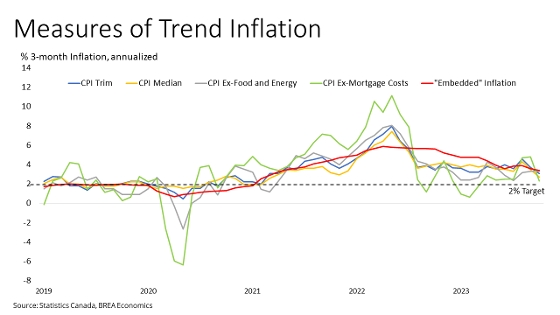
Canadian prices, as measured by the Consumer Price Index (CPI), rose 3.1 per cent on a year-over-year basis in October, down from 3.8 per cent in September. Excluding gasoline, CPI rose 3.6 per cent year-over-year in October. Shelter costs continue to be the main driver of inflation, with mortgage interest costs up 30.5 per cent and rent up 8.2 per cent. Grocery price inflation continued to moderate, albeit slowly and still elevated at 5.4 per cent year-over-year. Month over month, seasonally adjusted CPI fell 0.1 per cent, largely as a result of falling gasoline prices. In BC, consumer prices rose 2.7 per cent year-over-year. The Bank of Canada's preferred measures of core inflation showed significant downward momentum for the first time in months, falling to around 3.5 per cent year-over-year after trending near 4 per cent since the spring. 

While the main contributor to lower inflation this month was falling gas prices, there were other strong signs of progress on inflation that should please the Bank of Canada.  The three-month trend in core inflation measures fell to between 2.7 and 3.1 per cent and inflation excluding mortgage interest costs fell to just 2.2 per cent. Those trends, along with slowing GDP growth and early signs of a weakening labour market, should keep the Bank of Canada sidelined in December and looking to lower rates in 2024. 

Link: https://mailchi.mp/bcrea/canadian-inflation-october-2023-november-21-2023

For more information, please contact: Gino Pezzani.

Read

Canadian housing starts rose 1 per cent to 274,681 units in October at a seasonally adjusted annual rate (SAAR). Starts were up 4 per cent from the same month last year. Single-detached housing starts rose 5 per cent from last month to 59,911 units, while multi-family and others rose 1 per cent to 214,768 units (SAAR). 

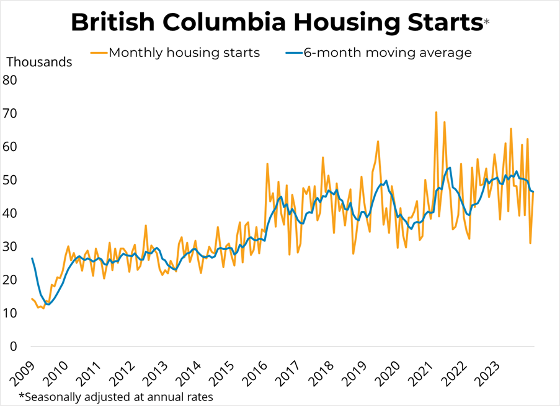
In British Columbia, starts jumped 50 per cent from last month to 60,174 units SAAR in all areas of the province. In areas in the province with 10,000 or more residents, single-detached starts were unchanged from last month at 5,588 units while multi-family starts surged 65 per cent to 51,813 units. Starts in the province were 33 per cent above the levels from October 2022. Starts increased from last month by 9k units in Vancouver, 6.2k in Victoria, 2.9k in Kelowna, and 2.2k in Abbotsford. The 6-month moving average trend in BC fell by 0.3 per cent to 50,887 SAAR. 


Link: https://mailchi.mp/bcrea/canadian-housing-starts-october-2023

For more information, please contact: Gino Pezzani.

Read

For the complete news release, including detailed statistics, click here.

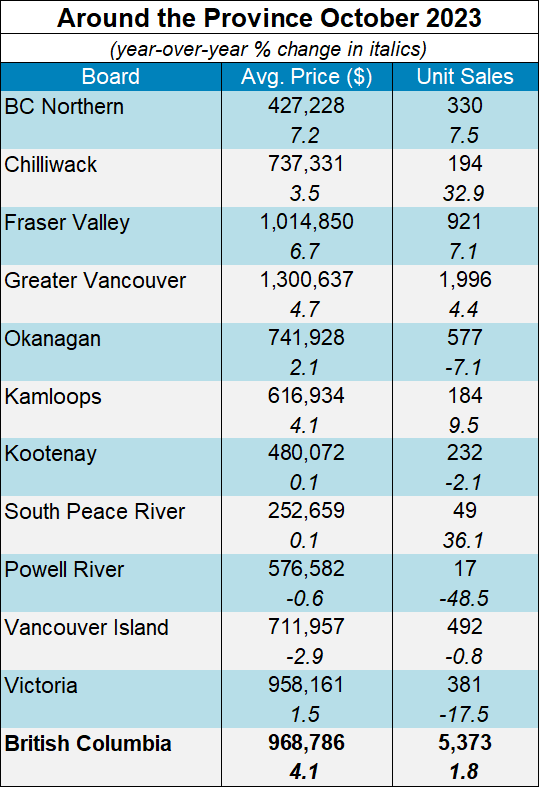
Vancouver, BC – November, 2023. The British Columbia Real Estate Association (BCREA) reports that a total of 5,373 residential unit sales were recorded in Multiple Listing Service® (MLS®) systems in October 2023, an increase of 1.8 per cent from October 2022. The average MLS® residential price in BC was $968,786 up 4.1 per cent compared to October 2022. The total sales dollar volume was $5.2 billion, representing a 6 per cent increase from the same time last year. 

“Home sales have slowed as expected given high borrowing costs and a punishing stress test,” said BCREA Chief Economist Brendon Ogmundson. “However, the inventory of homes for sale remains quite low, despite a modest uptick in new listings. Consequently, markets have found balance, though at a very low level of activity.”

On a seasonally adjusted basis, active listings in the province have increased for the fifth consecutive month, but still remain low by historical standards and fall short of what is typically required for a sustainable market balance in the long term.

Year-to-date BC residential sales dollar volume was down 13.6 per cent to $63.1 billion, compared with the same period in 2022. Residential unit sales were down 105 per cent to 64,936 units, while the average MLS® residential price was down 3.4 per cent to $971,802. 

For more information, please contact: Gino Pezzani.

Read

Vancouver, B.C. – September, 2023 – Year-over-year declines in sales and dollar volumeshighlighted a qu ieter second quarter (Q2) of 2023 in the Lower Mainland's commercial real estate market.

There were 280 commercial real estate sales in the Lower Mainland in Q2 2023, a 56.5 per cent decrease from the 644 sales recorded in Q2 2022, according to data from Commercial Edge, a commercial real estate system operated by the Real Estate Board of Greater Vancouver (REBGV).

The total dollar value of commercial real estate sales in the Lower Mainland was $1.763 billion in Q2 2023, a 54 per cent decrease from $3.831 billion in Q2 2022.

"Real estate transactions across the Lower Mainland have been affected by some of the highest borrowing costs we've seen in over 10 years," Andrew Lis, REBGV’s Director of Economics and Data Analytics, said. "With the landscape for monetary policy looking set where it is for at least the near-term, it's likely we'll see the commercial real estate market continue along this trajectory for the rest of 2023."

Q2 2023 activity by category

Land: There were 83 commercial land sales in Q2 2023, which is a 62.6 per cent decrease from the 222 land sales in Q2 2022. The dollar value of land sales was $789 million in Q2 2023, a 57.6 per cent decrease from $1.863 billion in Q2 2022.

Office and Retail: There were 112 office and retail sales in the Lower Mainland in Q2 2023, which is down 51.3 per cent from the 230 sales in Q2 2022. The dollar value of office and retail sales was $281 million in Q2 2023, a 63.4 per cent decrease from $767 million in Q2 2022.

Industrial: There were 66 industrial land sales in the Lower Mainland in Q2 2023, which is a 59 per cent decrease from the 161 sales in Q2 2022. The dollar value of industrial sales was $428 million in Q2 2023, a 32.4 per cent decrease from $633 million in Q2 2022.

Multi-Family: There were 19 multi-family land sales in the Lower Mainland in Q2 2023, which is down 38.7 per cent from 31 sales in Q2 2022. The dollar value of multi-family sales was $266 million in Q2 2023, a 53.2 per cent decrease from $568 million in Q2 2022.

For more information, please contact: Gino Pezzani.

Read

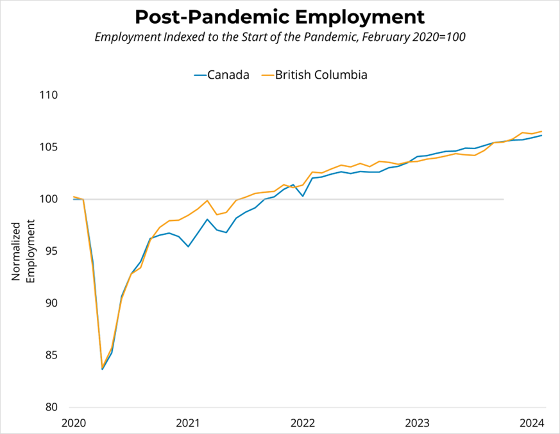
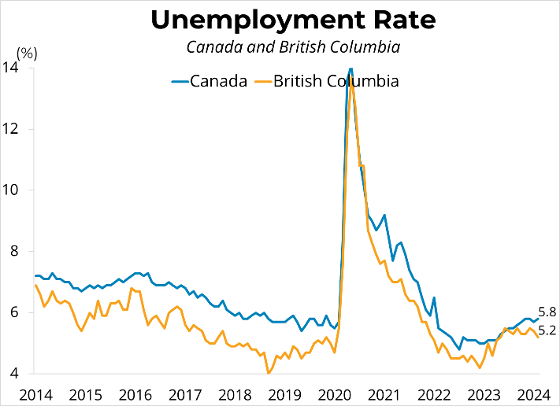
Canadian employment rose by 17,500 (0.1 per cent) in October. The Canadian unemployment rate jumped to 5.7 per cent, following three consecutive months at 5.5 per cent. Average hourly wages rose 4.8 per cent year-over-year to $34.08 in October, while total hours worked were up 2.1 per cent from October of last year.

Employment in BC dipped 0.1 per cent to 2.81 million, while employment in Metro Vancouver fell 0.3 per cent to 1.61 million. The unemployment rate was unchanged in both areas at 5.4 per cent in BC and 5.8 per cent in Metro Vancouver. 

Link: https://mailchi.mp/bcrea/canadian-employment-october-2023-november-3rd-2023

For more information, please contact: Gino Pezzani.
Read
Categories:   Albion, Maple Ridge Real Estate | April 2023 Newsletter | April 2024 Newsletter | April Newsletter 2022 | Arbutus, Vancouver West Real Estate | August 2021 News | August 2022 Newsletter | August 2023 Newsletters | August 2024 Newsletter | Bank | Blueridge NV, North Vancouver Real Estate | Brentwood Park, Burnaby North Real Estate | Brighouse South, Richmond Real Estate | Brighouse, Richmond Real Estate | British Properties, West Vancouver Real Estate | Burke Mountain, Coquitlam Real Estate | Burnaby Lake, Burnaby South Real Estate | Cambie, Vancouver West Real Estate | Canadian Employment | Canadian Inflation | Canyon Heights NV, North Vancouver Real Estate | Canyon Springs, Coquitlam Real Estate | Capitol Hill BN, Burnaby North Real Estate | Central Lonsdale, North Vancouver Real Estate | Central Park BS, Burnaby South Real Estate | Champlain Heights, Vancouver East Real Estate | Citadel PQ, Port Coquitlam Real Estate | Cloverdale BC, Cloverdale Real Estate | Coal Harbour, Vancouver West Real Estate | Collingwood VE, Vancouver East Real Estate | Coquitlam West, Coquitlam Real Estate | COVID-19 Recovery Dashboard | December 2021 Newsletter | December 2022 Newsletter | December 2023 Newsletter | December 2024 Newsletter | Delta Manor, Ladner Real Estate | Downtown NW, New Westminster Real Estate | Downtown VW, Vancouver West Real Estate | Downtown, Vancouver West Real Estate | Dunbar, Vancouver West Real Estate | Eagle Harbour, West Vancouver Real Estate | East Burnaby, Burnaby East Real Estate | East Newton, Surrey Real Estate | East Richmond, Richmond Real Estate | Fairview VW, Vancouver West Real Estate | False Creek, Vancouver West Real Estate | February Newsletter 2022 | February Newsletter 2023 | February Newsletter 2024 | Forest Hills BN, Burnaby North Real Estate | Fraser VE, Vancouver East Real Estate | Fraserview NW, New Westminster Real Estate | Fraserview VE, Vancouver East Real Estate | GDP | Grandview VE, Vancouver East Real Estate | Grandview Woodland, Vancouver East Real Estate | Greentree Village, Burnaby South Real Estate | Hamilton RI, Richmond Real Estate | Hamilton, Richmond Real Estate | Hastings, Vancouver East Real Estate | Highgate, Burnaby South Real Estate | House Marketing | Housing Starts | Interest Rate | Ironwood, Richmond Real Estate | January Newsletter 2022 | January Newsletter 2023 | January Newsletter 2024 | January Newsletter 2025 | July 2021 Newsletter | July 2022 Newsletter | July 2023 Newsletter | July 2024 Newsletter | June 2022 Newsletter | June 2023 Newsletter | June 2024 Newsletter | Killarney VE, Vancouver East Real Estate | Kitsilano, Vancouver West Real Estate | Knight, Vancouver East Real Estate | Letter From The Heart | Lions Bay, West Vancouver Real Estate | Lower Lonsdale, North Vancouver Real Estate | Maillardville, Coquitlam Real Estate | Main, Vancouver East Real Estate | March Newsletter 2022 | March Newsletter 2023 | March Newsletter 2024 | May 2022 Newsletter | May 2023 Newsletter | May 2024 Newsletter | Meadow Brook, Coquitlam Real Estate | Metrotown, Burnaby South Real Estate | Mount Pleasant VE, Vancouver East Real Estate | Mount Pleasant VW, Vancouver West Real Estate | New Horizons, Coquitlam Real Estate | Newsletter November 2021 | North Coquitlam, Coquitlam Real Estate | North Vancouver Real Estate | November 2021 Newsletter | November 2022 Newsletter | November 2023 Newsletter | November 2024 Newsletter | November Newsletter 2021 | October 2021 Newsletter | October 2022 Newsletter | October 2023 Newsletter | October 2024 Newsletter | Pebble Hill, Tsawwassen Real Estate | Pictures and thoughts to share | Point Grey, Vancouver West Real Estate | Quay, New Westminster Real Estate | Queen Mary Park Surrey, Surrey Real Estate | Queensborough, New Westminster Real Estate | Quilchena, Vancouver West Real Estate | Richmond Real Estate | S.W. Marine, Vancouver West Real Estate | Sapperton, New Westminster Real Estate | September 2021 News | September 2022 Newsletter | September 2023 Newsletter | September 2024 Newsletters | Silver Valley, Maple Ridge Real Estate | Simon Fraser Univer., Burnaby North Real Estate | Sold listings | South Granville, Vancouver West Real Estate | South Marine, Vancouver East Real Estate | South Slope, Burnaby South Real Estate | South Surrey White Rock Real Estate | Squamish Real Estate | Steveston South, Richmond Real Estate | Sullivan Heights, Burnaby North Real Estate | The Crest, Burnaby East Real Estate | Tsawwassen Central, Tsawwassen Real Estate | University VW, Vancouver West Real Estate | Upper Eagle Ridge, Coquitlam Real Estate | Uptown NW, New Westminster Real Estate | vancouver island Real Estate | Vancouver Real Estate | Victoria VE, Vancouver East Real Estate | Victoria VE, Vancouver West Real Estate | WALL CENTRE FALSE CREEK, Vancouver West Real Estate | West End VW, Vancouver West Real Estate | Westwood Plateau, Coquitlam Real Estate | Whalley, North Surrey Real Estate | Whalley, Surrey Real Estate | Willoughby Heights, Langley Real Estate | Yale - Dogwood Valley, Vancouver West Real Estate | Yaletown, Vancouver West Real Estate | Yel | Yelllow Newsletter July 2022 | Yellow Newletter December 2021 | Yellow Newletter June 2022 | Yellow Newsletter | Yellow Newsletter April 2022 | Yellow Newsletter April 2023 | Yellow Newsletter April 2024 | Yellow Newsletter August 2021 | Yellow Newsletter August 2022 | Yellow Newsletter August 2023 | Yellow Newsletter August 2024 | Yellow Newsletter December 2021 | Yellow Newsletter December 2022 | Yellow Newsletter December 2023 | Yellow Newsletter December 2024 | Yellow Newsletter February 2022 | Yellow Newsletter February 2023 | Yellow Newsletter February 2024 | Yellow Newsletter January 2022 | Yellow Newsletter January 2023 | Yellow Newsletter January 2024 | Yellow Newsletter January 2025 | Yellow Newsletter July 2022 | Yellow Newsletter July 2023 | Yellow Newsletter July 2024 | Yellow Newsletter June 2022 | Yellow Newsletter June 2023 | Yellow Newsletter June 2024 | Yellow Newsletter March 2022 | Yellow Newsletter March 2023 | Yellow Newsletter March 2024 | Yellow Newsletter May 2022 | Yellow Newsletter May 2023 | Yellow Newsletter May 2024 | Yellow Newsletter November 2021 | Yellow Newsletter November 2022 | Yellow Newsletter November 2023 | Yellow Newsletter November 2024 | Yellow Newsletter October 2021 | Yellow Newsletter October 2022 | Yellow Newsletter October 2023 | Yellow Newsletter October 2024 | Yellow Newsletter October, 2021 | Yellow Newsletter September 2021 | Yellow Newsletter September 2022 | Yellow Newsletter September 2023 | Yellow Newsletter September 2024
Reciprocity Logo The data relating to real estate on this website comes in part from the MLS® Reciprocity program of either the Greater Vancouver REALTORS® (GVR), the Fraser Valley Real Estate Board (FVREB) or the Chilliwack and District Real Estate Board (CADREB). Real estate listings held by participating real estate firms are marked with the MLS® logo and detailed information about the listing includes the name of the listing agent. This representation is based in whole or part on data generated by either the GVR, the FVREB or the CADREB which assumes no responsibility for its accuracy. The materials contained on this page may not be reproduced without the express written consent of either the GVR, the FVREB or the CADREB.