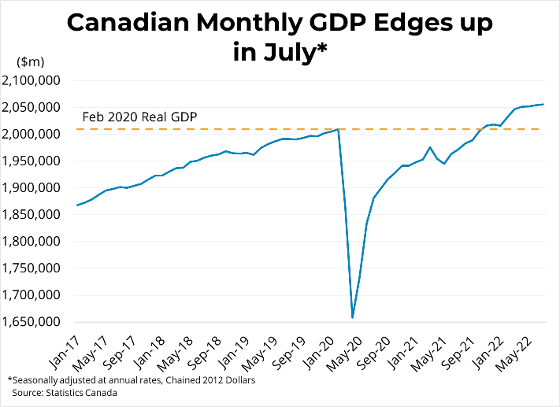
Canadian GDP edged up by 0.1 per cent in July, following a similar increase in June. Growth in goods-producing industries (+0.5 per cent) offset declines in service-producing industries (-0.1 per cent) as GDP grew in 11 of 20 subsectors. Canadian real GDP is roughly 2.3 per cent above its pre-pandemic, February 2020 level. Preliminary estimates suggest that output in the Canadian economy was essentially flat in August. GDP from the offices of real estate agents and brokers dropped 3.4% in July, the fifth consecutive decline, as rising interest rates continued to restrain home sales. 

GDP growth in recent months, though still positive, is showing signs of slowing. That slowdown will likely continue as the Bank continues its tightening cycle, particularly in interest rate sensitive sectors like housing. As expected, the Bank raised its overnight rate in September to 3.25 per cent and the final destination for the overnight rate may be closer to 4 per cent. However, with the rate now above the bank's estimate of the neutral rate, meaning monetary policy is no longer stimulative, increases in the overnight rate are expected to slow in subsequent announcements. 


Link:  https://mailchi.mp/bcrea/canadian-economic-growth-real-gdp-july-2022

For more information, please contact: Gino Pezzani.

Read

To view the full Commercial Leading Indicator PDF, click here.   

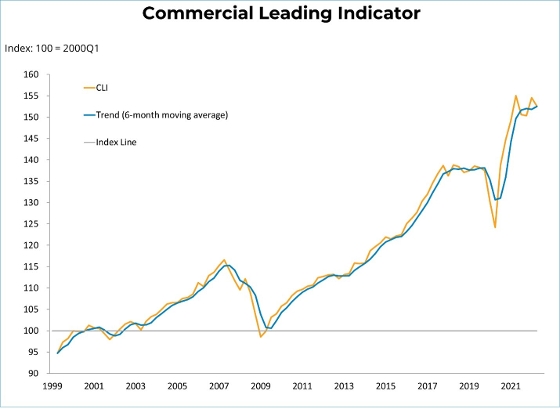
The BCREA Commercial Leading Indicator (CLI) fell to 153 from 155 in the second quarter of 2022, but the six-month moving average hit a record high. Compared to the same time in 2021, the index was down by 1.6 per cent.

It is important to note that while the Canadian economy generally continues recovering strongly, the environment for commercial real estate remains highly abnormal and uncertain. Although the CLI was designed to interpret economic and office employment growth as positive indicators for commercial real estate demand, the recent strong growth of these indicators may not translate as readily into improved conditions in the commercial real estate market relative to the pre-pandemic period.

The CLI fell in the second quarter due to deteriorations in the economic and financial components of the index, while employment contributed somewhat positively.

The economic activity index was driven downwards by inflation-adjusted declines in wholesale trade, retail and manufacturing sales. Rapid appreciation in the consumer price index caused by supply chain obstacles and the war in Ukraine meant that rising nominal values in these economic areas were offset after adjusting for general price growth. The financial component of the index was negative as a result of falling REIT prices.

Although falling spreads between corporate and government costs contributed positively, it was not enough to bump the financial component of the index into positive territory. The index’s employment component was slightly positive, with a rise in office (finance, insurance and real estate) employment offsetting a fall in manufacturing employment.

For more information, please contact: Gino Pezzani.

Read

During August, home sales continued to decline in BC. Starts rose while new listings declined. Sales fell once again all over the province, with all areas of the province below pre-pandemic levels except for the North. Rental costs in Vancouver and Victoria continue broadly rising and remain elevated relative to most other points since the onset of the pandemic.

Retail sales declined in July on lower gasoline and clothing sales. Restaurant reservations in Vancouver are back to pre-pandemic levels. In BC, Google’s measure of movement trends is currently just 4 per cent below pre-pandemic levels. .

Although aggregate employment has recovered in BC to pre-pandemic levels, the accommodation & food service sector remained about 13 per cent below the pre-pandemic level in August. The labour market has served high-income workers much better than low-income workers. Employment in high-income industries is about 10 per cent above pre-pandemic employment levels, while employment in low-income sectors is about 6 per cent below pre-pandemic employment levels.

Exports, imports, and manufacturing sales all fell in July.

Business confidence retreated in August, likely on continuing fears related to higher inflation expectations and rising interest rates.

The number of US and non-US tourists rose again in July, with both US and non-US tourists reaching the highest level since the onset of the pandemic.

For a more comprehensive overview of BC's economic recovery, click here.

For more information, please contact: Gino Pezzani.

Read

Canadian seasonally-adjusted retail sales decreased 2.5 per cent in July to $61.3 billion. Sales fell in 9 of 11 subsectors, but were led by higher sales at gasoline stations and clothing or clothing accessories. Core retail sales, which strips out gasoline and motor vehicle and parts dealers, fell 0.9 per cent in July. In volume terms, sales were down 2 per cent. 

In BC, seasonally-adjusted sales fell 1.5 per cent in July. Compared to the same month last year, retail sales were up 4.2 per cent in the province. In the Greater Vancouver region, sales fell 2.2 per cent month-over-month and were up 5.6 per cent year-over-year. 

In July, Canadian e-commerce sales were flat month over month, corresponding to 4.7 per cent of retail sales. This percentage remains elevated relative to pre-pandemic levels, but is lower than during core months of the pandemic in 2020 and 2021. 


Link:  https://mailchi.mp/bcrea/canadian-retail-sales-july-2022

For more information, please contact: Gino Pezzani.

Read

Canadian prices, as measured by the Consumer Price Index (CPI), rose 7 per cent on a year-over-year basis in August, down from 7.6 per cent last month. This was the second consecutive month of decelerating price growth driven primarily by declining gasoline prices. Excluding gasoline, the CPI rose 6.3 per cent year over year in August, down from 6.6 per cent in July. This reduced pace of price appreciation was driven by slowing increases in the price of transportation (+10.3 per cent) and shelter (+6.6 per cent), although grocery prices rose quickly (+11.9 per cent). Month-over-month, on a seasonally-adjusted basis, prices were up 0.1 per cent, the slowest rate since December 2020. In BC, consumer prices rose 7.3 per cent year-over-year, down from 8 per cent last month. Average hourly wages grew 5.4 per cent year-over-year in August, indicating a decline in purchasing power. 

August's CPI numbers continued to provide encouraging signs that inflation may be slowing. The latest data show declines not just driven by falling gas prices, but a softening in the rate of appreciation in core inflation including transport and shelter. However, markets will want to see sustained declines in the rate of inflation over the next several months before mortgage rates decline significantly. Bond yields are continuing to trend upwards, meaning that markets are still expecting an aggressive Bank of Canada singularly focused on bringing inflation back to its 2 per cent target.

Link: https://mailchi.mp/bcrea/canadian-inflation-august-2022

For more information, please contact: Gino Pezzani.

Read

Canadian housing starts fell by 7.7k (2.8 per cent) to 267.4k units in August at a seasonally-adjusted annual rate (SAAR). Comparing year-over-year, starts were up from August of 2021 (2.5 per cent). Single-detached housing starts rose 1 per cent to 73.4k, while multi-family and others declined 4.2 per cent to 194k (SAAR). 

In British Columbia, starts increased by 0.8 per cent in August, rising to 49.5k units SAAR in all areas of the province. In areas in the province with 10,000 or more residents, single-detached starts fell 6.7 per cent m/m to 6.7k units while multi-family starts rose 1.6 per cent to 39k units. Starts in the province were 5.7 per cent above the levels from August 2021. Starts were flat month over month in Vancouver, up by 6.5k in Kelowna, and down by 1.3k in Abbotsford and 6.8k in Victoria. The 6-month moving average trend rose 5.4 per cent to 47.1k in BC in August. 


Link: https://mailchi.mp/bcrea/canadian-housing-starts-august-2022

For more information, please contact: Gino Pezzani.

Read


For the complete news release, including detailed statistics, click here.

Vancouver, BC – September, 2022. The British Columbia Real Estate Association (BCREA) reports that a total of 5,645 residential unit sales were recorded by the Multiple Listing Service® (MLS®) in August 2022, a decrease of 40.8 per cent from August 2021. The average MLS® residential price in BC was $918,378, a 2.1 per cent increase from $899,428 recorded in August 2021. Total sales dollar volume was $5.2 billion, a 39.6 per cent decline from the same time last year. 

“Housing activity across the province remains well below normal but is showing signs of stabilizing,” said BCREA Chief Economist Brendon Ogmundson. “While inventory is up over last year, active listings have somewhat stalled at relatively low levels in most major markets and as a result we are seeing a healthier balance compared to last year.”

Year-to-date, BC residential sales dollar volume was down 22.1 per cent from the same period in 2021 to $63.8 billion. Residential unit sales were down 30.5 per cent to 62,502 units, while the average MLS® residential price was up 12 per cent to $1.02 million.


For more information, please contact: Gino Pezzani.

Read

Canadian employment declined by 40,000 (-0.2 per cent) to 19.527 million in August, falling for the third consecutive month. The Canadian unemployment rate also jumped by 0.5 to 5.4 per cent, rising from the lowest rate on record in the prior two months and up for the first time in seven months. Average hourly wages were up 5.4 per cent year-over-year, increasing from 5.2 per cent in June and July. Wage gains remain below the inflation rate, however, which hit 7.6 per cent year-over-year in the most-recent data. Total hours worked were unchanged in August, but are up 3.7 per cent year-over-year.

Employment in BC declined by 28.1k to 2.719 million in August, while Metro Vancouver's employment fell by 2.1k month over month. The unemployment rate rose in August to 4.8 per cent. Among the provinces, only Quebec currently has a lower unemployment rate. 

Link: https://mailchi.mp/bcrea/canadian-employment-august-2022

For more information, please contact: Gino Pezzani.

Read

BCREA 2022 Third Quarter Housing Forecast Update

To view the BCREA Housing Forecast Update PDF, click here.

Vancouver, BC – September, 2022. The British Columbia Real Estate Association (BCREA) released its 2022 Third Quarter Housing Forecast Update today.

Multiple Listing Service® (MLS®) residential sales in BC are forecast to decline 34.4 per cent from a record high 2021 to 81,900 units this year. In 2023, MLS® residential sales are forecast to fall an additional 5 per cent to 77,790 units.

“Mortgage rates have risen at a much faster rate and to a higher level than previously anticipated,” said BCREA Chief Economist Brendon Ogmundson. “Faced with a dramatic shift in the cost of borrowing, housing market activity is likely to fall well below normal over the next year.”

Weaker sales and rising inventory mean that some regions, largely in more expensive markets, have tipped into buyers’ market territory. Consequently, average MLS® home prices have come down from peak levels.

While the housing market is currently feeling the weight of higher interest rates, the downturn is unlikely to be long-lived as BC’s strong population growth combined with extremely favourable demographics means there will be no shortage of demand for housing in the province.  

For the complete news release, including detailed statistics, click here.

For more information, please contact: Gino Pezzani.

Read
Categories:   Albion, Maple Ridge Real Estate | April 2023 Newsletter | April Newsletter 2022 | Arbutus, Vancouver West Real Estate | August 2021 News | August 2022 Newsletter | August 2023 Newsletters | Bank | Blueridge NV, North Vancouver Real Estate | Brentwood Park, Burnaby North Real Estate | Brighouse South, Richmond Real Estate | Brighouse, Richmond Real Estate | British Properties, West Vancouver Real Estate | Burke Mountain, Coquitlam Real Estate | Burnaby Lake, Burnaby South Real Estate | Cambie, Vancouver West Real Estate | Canadian Employment | Canadian Inflation | Canyon Heights NV, North Vancouver Real Estate | Canyon Springs, Coquitlam Real Estate | Capitol Hill BN, Burnaby North Real Estate | Central Lonsdale, North Vancouver Real Estate | Central Park BS, Burnaby South Real Estate | Champlain Heights, Vancouver East Real Estate | Citadel PQ, Port Coquitlam Real Estate | Cloverdale BC, Cloverdale Real Estate | Coal Harbour, Vancouver West Real Estate | Collingwood VE, Vancouver East Real Estate | Coquitlam West, Coquitlam Real Estate | COVID-19 Recovery Dashboard | December 2021 Newsletter | December 2022 Newsletter | December 2023 Newsletter | Delta Manor, Ladner Real Estate | Downtown NW, New Westminster Real Estate | Downtown VW, Vancouver West Real Estate | Downtown, Vancouver West Real Estate | Dunbar, Vancouver West Real Estate | Eagle Harbour, West Vancouver Real Estate | East Burnaby, Burnaby East Real Estate | East Newton, Surrey Real Estate | East Richmond, Richmond Real Estate | Fairview VW, Vancouver West Real Estate | False Creek, Vancouver West Real Estate | February Newsletter 2022 | February Newsletter 2023 | February Newsletter 2024 | Forest Hills BN, Burnaby North Real Estate | Fraser VE, Vancouver East Real Estate | Fraserview NW, New Westminster Real Estate | Fraserview VE, Vancouver East Real Estate | GDP | Grandview VE, Vancouver East Real Estate | Grandview Woodland, Vancouver East Real Estate | Greentree Village, Burnaby South Real Estate | Hamilton RI, Richmond Real Estate | Hamilton, Richmond Real Estate | Hastings, Vancouver East Real Estate | Highgate, Burnaby South Real Estate | House Marketing | Housing Starts | Interest Rate | Ironwood, Richmond Real Estate | January Newsletter 2022 | January Newsletter 2023 | January Newsletter 2024 | July 2021 Newsletter | July 2022 Newsletter | July 2023 Newsletter | June 2022 Newsletter | June 2023 Newsletter | Killarney VE, Vancouver East Real Estate | Kitsilano, Vancouver West Real Estate | Knight, Vancouver East Real Estate | Letter From The Heart | Lions Bay, West Vancouver Real Estate | Lower Lonsdale, North Vancouver Real Estate | Maillardville, Coquitlam Real Estate | Main, Vancouver East Real Estate | March Newsletter 2022 | March Newsletter 2023 | March Newsletter 2024 | May 2022 Newsletter | May 2023 Newsletter | Meadow Brook, Coquitlam Real Estate | Metrotown, Burnaby South Real Estate | Mount Pleasant VE, Vancouver East Real Estate | Mount Pleasant VW, Vancouver West Real Estate | New Horizons, Coquitlam Real Estate | Newsletter November 2021 | North Coquitlam, Coquitlam Real Estate | North Vancouver Real Estate | November 2021 Newsletter | November 2022 Newsletter | November 2023 Newsletter | November Newsletter 2021 | October 2021 Newsletter | October 2022 Newsletter | October 2023 Newsletter | Pebble Hill, Tsawwassen Real Estate | Pictures and thoughts to share | Point Grey, Vancouver West Real Estate | Quay, New Westminster Real Estate | Queen Mary Park Surrey, Surrey Real Estate | Queensborough, New Westminster Real Estate | Quilchena, Vancouver West Real Estate | Richmond Real Estate | S.W. Marine, Vancouver West Real Estate | Sapperton, New Westminster Real Estate | September 2021 News | September 2022 Newsletter | September 2023 Newsletter | Silver Valley, Maple Ridge Real Estate | Simon Fraser Univer., Burnaby North Real Estate | Sold listings | South Granville, Vancouver West Real Estate | South Marine, Vancouver East Real Estate | South Slope, Burnaby South Real Estate | South Surrey White Rock Real Estate | Squamish Real Estate | Steveston South, Richmond Real Estate | Sullivan Heights, Burnaby North Real Estate | The Crest, Burnaby East Real Estate | Tsawwassen Central, Tsawwassen Real Estate | University VW, Vancouver West Real Estate | Upper Eagle Ridge, Coquitlam Real Estate | Uptown NW, New Westminster Real Estate | vancouver island Real Estate | Vancouver Real Estate | Victoria VE, Vancouver East Real Estate | Victoria VE, Vancouver West Real Estate | WALL CENTRE FALSE CREEK, Vancouver West Real Estate | West End VW, Vancouver West Real Estate | Westwood Plateau, Coquitlam Real Estate | Whalley, North Surrey Real Estate | Whalley, Surrey Real Estate | Willoughby Heights, Langley Real Estate | Yale - Dogwood Valley, Vancouver West Real Estate | Yaletown, Vancouver West Real Estate | Yel | Yelllow Newsletter July 2022 | Yellow Newletter December 2021 | Yellow Newletter June 2022 | Yellow Newsletter | Yellow Newsletter April 2022 | Yellow Newsletter April 2023 | Yellow Newsletter August 2021 | Yellow Newsletter August 2022 | Yellow Newsletter August 2023 | Yellow Newsletter December 2021 | Yellow Newsletter December 2022 | Yellow Newsletter December 2023 | Yellow Newsletter February 2022 | Yellow Newsletter February 2023 | Yellow Newsletter February 2024 | Yellow Newsletter January 2022 | Yellow Newsletter January 2023 | Yellow Newsletter January 2024 | Yellow Newsletter July 2022 | Yellow Newsletter July 2023 | Yellow Newsletter June 2022 | Yellow Newsletter June 2023 | Yellow Newsletter March 2022 | Yellow Newsletter March 2023 | Yellow Newsletter March 2024 | Yellow Newsletter May 2022 | Yellow Newsletter May 2023 | Yellow Newsletter November 2021 | Yellow Newsletter November 2022 | Yellow Newsletter November 2023 | Yellow Newsletter October 2021 | Yellow Newsletter October 2022 | Yellow Newsletter October 2023 | Yellow Newsletter October, 2021 | Yellow Newsletter September 2021 | Yellow Newsletter September 2022 | Yellow Newsletter September 2023
Reciprocity Logo The data relating to real estate on this website comes in part from the MLS® Reciprocity program of either the Greater Vancouver REALTORS® (GVR), the Fraser Valley Real Estate Board (FVREB) or the Chilliwack and District Real Estate Board (CADREB). Real estate listings held by participating real estate firms are marked with the MLS® logo and detailed information about the listing includes the name of the listing agent. This representation is based in whole or part on data generated by either the GVR, the FVREB or the CADREB which assumes no responsibility for its accuracy. The materials contained on this page may not be reproduced without the express written consent of either the GVR, the FVREB or the CADREB.