The BCREA Economics team has created the Housing Monitor Dashboard to help REALTORS® monitor BC’s housing market. This dashboard, which is updated monthly, provides up-to-date data on key variables for public education and use. Focuses include:

Resale Home Market

Construction

Rental Market

Borrowing Costs

Other BCREA Data

In the dashboard, the image and data are available for download under each chart, where possible.

For more information, please contact: Gino Pezzani.

Read

To view the September 2023 Mortgage Rate Forecast PDF, click here.

Highlights:

1. Bank of Canada tightening sends mortgage rates to 15-year highs

2. Are high rates finally impacting economic growth?

3. How far will fixed mortgage rates fall once the Bank of Canada lowers its policy rate?

Additional economics information is available here on BCREA's website. 

For more information, please contact: Gino Pezzani.

Read

Canadian prices, as measured by the Consumer Price Index (CPI), rose 4 per cent on a year-over-year basis in August, up from 3.3 per cent in July. Excluding gasoline, CPI rose 4.1 per cent year-over-year in August, the same rate as July. Shelter costs were up 6 per cent year over year, up from 5.1 per cent in July, driven by mortgage interest costs (up 30.9 per cent from last year) along with rents (up 6.5 per cent). Grocery prices were up 6.9 per cent year over year in August, down from 8.5 per cent in July. Month over month, seasonally adjusted CPI rose 0.6 per cent. In BC, consumer prices rose 3.8 per cent year-over-year.

The annual change in CPI continued rising in August as gasoline base year effects ended (the year-over-year change in gasoline prices was positive for the first time since January). Although food price inflation continued to gradually ease, shelter and rent inflation rates rose from July. Moreover, the Bank of Canada's measures of core inflation, which strip out volatile components, remained stubbornly high; all three measures were flat or rose in August. With softening labour markets and a flat preliminary July GDP estimate following a small contraction in June, the Bank of Canada opted not to raise rates again in September. However, bond yields jumped following the unexpectedly hot August CPI release, suggesting markets think the Bank could change course again. Guiding inflation back down to 2 per cent was sure to be a bumpy ride and the possibility of another rate hike at the next meeting on October 25th or before the end of the year appears to be still on the table. 

Link: https://mailchi.mp/bcrea/canadian-inflation-august-2023

For more information, please contact: Gino Pezzani.

Read

Canadian housing starts fell 1 per cent to 252,787 units in August at a seasonally adjusted annual rate (SAAR). Starts were down 6 per cent from the same month last year. Single-detached housing starts rose 2 per cent to 55,665 units, while multi-family and others fell 2 per cent to 197,121 (SAAR).

In British Columbia, starts were unchanged in August at 50,687 units SAAR in all areas of the province. In areas in the province with 10,000 or more residents, single-detached starts rose 34 per cent m/m to 6,314 units while multi-family starts fell 4 per cent to 41,115 units. Starts in the province were 4 per cent above the levels from August 2022. Starts declined by 4.2k in Vancouver and rose by 2.6k in Victoria and 0.2k in Kelowna, while remaining unchanged in Abbotsford from the previous month. The 6-month moving average trend in BC rose by 4.1 per cent to 53,512 SAAR. 

Link: https://mailchi.mp/bcrea/canadian-housing-starts-august-2023

For more information, please contact: Gino Pezzani.

Read

How Auckland’s housing policy success can inspire BC’s new Homes for People housing action plan

Vancouver, BC – September, 2023. As British Columbia continues to grapple with an ongoing housing crisis, a new economic report reveals how the province’s Homes for People housing plan can expand housing supply and improve housing affordability by following the blueprint of New Zealand’s Auckland Unitary Plan (AUP).

According to the latest Market Intelligence report from the BC Real Estate Association (BCREA), following the aggressive housing liberalization and upzoning policy in Auckland would eventually improve affordability in BC by slowing home price growth and allowing incomes to catch up. Additionally, expanding the housing stock would lead to healthier resale inventories and balance markets while shifting the distribution of sales toward principal owners by reducing speculative activity.

Summary Findings:

New evidence from Auckland shows that policy change can achieve a 50 per cent increase in housing permits in less than a decade and successfully soften housing costs.

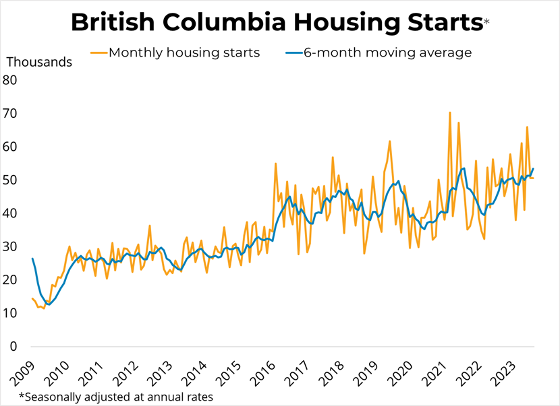
BC is currently experiencing historically low per capita housing starts, and a 50 per cent boost in starts by the end of this decade would bring activity back to the level of the early 90s, but still far below the levels of the 70s.

BCREA’s Real Estate Policy Analysis Model (REPAM) predicts that such a boom in housing starts would increase home completions by 37 per cent per quarter relative to a status quo baseline by Q4 of 2030, while the total housing stock would be 2 per cent higher.

The model predicts that the increase in housing supply would pull average prices down by 4 per cent relative to a status quo baseline by Q4 of 2030, and slow long-run price growth, modestly improving affordability.

Read the Report

“While it is promising to see that steps can be taken, affordability in BC deteriorated due to chronic underbuilding for decades, and will not quickly be remedied,” says BCREA Chief Economist Brendon Ogmundson. “Still, if policymakers can increase housing supply quickly and extensively through a combination of measures, there is hope that affordability can improve in the province again.”

“These results are encouraging, but the scale and immediacy of the problem are considerable,” Ogmundson adds.

Since the start of the COVID-19 pandemic, average home prices in BC have risen nearly 40 per cent, with new rental costs up by a similar amount. Listings on the MLS® system have plummeted by nearly a quarter. However, the report shows that BC’s forthcoming housing plan has the potential to enable a building boom similar in magnitude to the AUP through a policy of re-zoning and incentives for new home construction. By bringing per capita starts back to a more historically normal level, the affordability ratio can gradually be bent in the right direction.

For more information, please contact: Gino Pezzani.

The link: 2023-09-25-market-intelligence.pdf (bcrea.bc.ca)

Read

For the complete news release, including detailed statistics, click here.

Vancouver, BC – September, 2023. The British Columbia Real Estate Association (BCREA) reports that a total of 6,608 residential unit sales were recorded in Multiple Listing Service® (MLS®) systems in August 2023, an increase of 15.7 per cent from August 2022. The average MLS® residential price in BC was $958,424, up 5.2 per cent compared to August 2022. The total sales dollar volume was $6.3 billion, representing a 21.7 per cent increase from the same time last year.

“Home sales are starting to settle back into a trend of below-normal activity following an unexpected surge in the spring,” said BCREA Chief Economist Brendon Ogmundson. “However, sales are in a much stronger place than expected given current mortgage qualifying difficulty.”

Active listings in the province were flat month-over-month at just over 31,000 total listings and up slightly year-over-year.

Year-to-date BC residential sales dollar volume was down 17.4 per cent to $52.7 billion, compared with the same period in 2022. Residential unit sales were down 13.4 per cent to 54,126 units, while the average MLS® residential price was down 4.6 per cent to $973,011.

For more information, please contact: Gino Pezzani.

Read

To view the full Commercial Leading Indicator PDF, click here.

The BCREA Commercial Leading Indicator (CLI) rose 0.6 points to 147 in the second quarter of 2023, while the six-month moving average fell to 147. Compared to the same quarter in 2022, the index was down by 4.7 per cent.

It is important to note that the environment for commercial real estate remains highly abnormal and uncertain. The CLI is designed to interpret economic and office employment growth as positive indicators for commercial real estate demand. The recent strong growth in these indicators may not translate as readily into improved commercial real estate market conditions due to structural changes in the economy caused by the COVID-19 pandemic.

The CLI rose slightly in the employment and financial categories while declining in the economic category. An increase in real retail sales was offset by a decline in manufacturing sales. Meanwhile, a drop in inflation-adjusted wholesale trade pulled the economic component into negative territory. Spreads between corporate and government borrowing costs declined slightly in the second quarter, offsetting the impact of a slight weakening in prices of Real Estate Investment Trusts (REIT). This resulted in a net positive contribution from the financial component of the index. Finally, a rise in office employment (finance, insurance, and real estate) more than counteracted a drop in manufacturing employment, causing a net increase in the index’s employment component.

For more information, please contact: Gino Pezzani.

Read

Canadian employment rose by 40,000 (0.2 per cent) in August. The Canadian unemployment rate remained flat at 5.5 per cent, pausing after having risen three prior consecutive months. Average hourly wages rose 4.9 per cent year-over-year to $33.47 in August, while total hours worked were up 2.6 per cent from August of last year.

Employment in BC rose 0.4 per cent to 2.79 million, while employment in Metro Vancouver rose 0.6 per cent to 1.58 million. The unemployment rate fell to 5.2 per cent in BC, down from 5.4 per cent in July, while falling to 5.8 per cent in Metro Vancouver. 

Link: https://mailchi.mp/bcrea/canadian-employment-august-2023-september-8th-2023

For more information, please contact: Gino Pezzani.

Read

As summer winds to a close, higher borrowing costs have begun to permeate the Metro Vancouver housing market in predictable ways, with price gains cooling and sales slowing along the typical seasonal pattern.

Here's a summary of the August 2023 housing market statistics.

The link: August 2023 Market Insights | REBGV - YouTube

For more information, please contact: Gino Pezzani.

Read

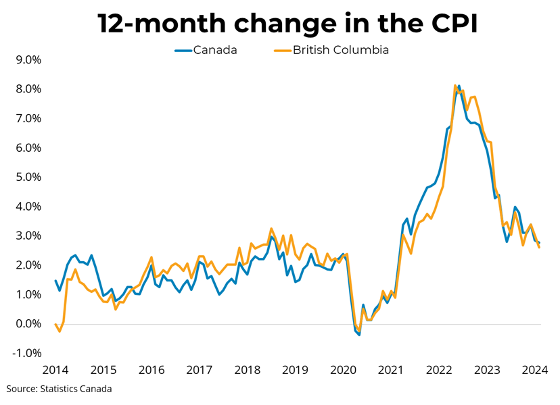
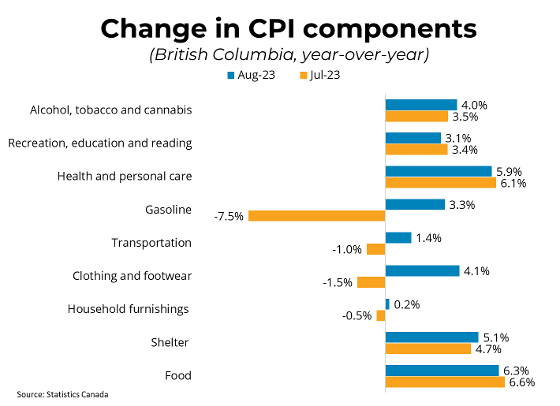
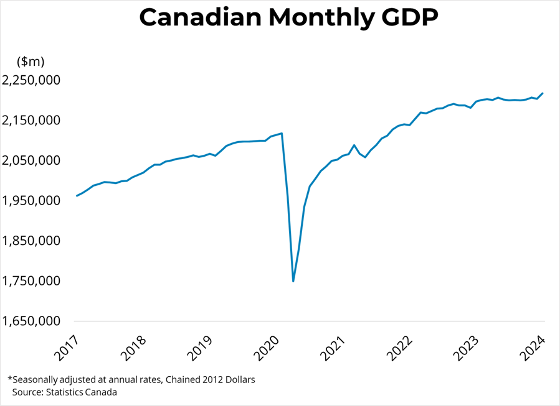
The Bank of Canada maintained its overnight rate at 5 per cent this morning. In the statement accompanying the decision, the Bank noted that the Canadian economy has entered a period of weaker growth, with slowing household spending and housing activity. On inflation, the Bank cited that recent data indicates inflationary pressures are broad-based and rising gas prices may cause a near term increase in CPI inflation. Meanwhile, core measures of inflation continue to trend near 3.5 per cent with little recent downward momentum.

Higher borrowing costs seemed to finally being felt as the Canadian economy contracted at an annualized rate of 0.2 per cent in the second quarter and the preliminary estimate for July showed zero growth.  However, with the inflation rising to 3.3 per cent as of the latest data in July, the effects of prior rate hikes still have work to do to bring inflation back down towards the Bank's target of 2 per cent. While the Bank of Canada decided to maintain its overnight rate at 5 per cent, persistent inflationary pressures are a concern and could still lead to future rate increases.

Link: https://mailchi.mp/bcrea/bank-of-canada-interest-rate-announcement-sl68zxi0f8

For more information, please contact: Gino Pezzani.

Read
Categories:   Albion, Maple Ridge Real Estate | April 2023 Newsletter | April 2024 Newsletter | April Newsletter 2022 | Arbutus, Vancouver West Real Estate | August 2021 News | August 2022 Newsletter | August 2023 Newsletters | Bank | Blueridge NV, North Vancouver Real Estate | Brentwood Park, Burnaby North Real Estate | Brighouse South, Richmond Real Estate | Brighouse, Richmond Real Estate | British Properties, West Vancouver Real Estate | Burke Mountain, Coquitlam Real Estate | Burnaby Lake, Burnaby South Real Estate | Cambie, Vancouver West Real Estate | Canadian Employment | Canadian Inflation | Canyon Heights NV, North Vancouver Real Estate | Canyon Springs, Coquitlam Real Estate | Capitol Hill BN, Burnaby North Real Estate | Central Lonsdale, North Vancouver Real Estate | Central Park BS, Burnaby South Real Estate | Champlain Heights, Vancouver East Real Estate | Citadel PQ, Port Coquitlam Real Estate | Cloverdale BC, Cloverdale Real Estate | Coal Harbour, Vancouver West Real Estate | Collingwood VE, Vancouver East Real Estate | Coquitlam West, Coquitlam Real Estate | COVID-19 Recovery Dashboard | December 2021 Newsletter | December 2022 Newsletter | December 2023 Newsletter | Delta Manor, Ladner Real Estate | Downtown NW, New Westminster Real Estate | Downtown VW, Vancouver West Real Estate | Downtown, Vancouver West Real Estate | Dunbar, Vancouver West Real Estate | Eagle Harbour, West Vancouver Real Estate | East Burnaby, Burnaby East Real Estate | East Newton, Surrey Real Estate | East Richmond, Richmond Real Estate | Fairview VW, Vancouver West Real Estate | False Creek, Vancouver West Real Estate | February Newsletter 2022 | February Newsletter 2023 | February Newsletter 2024 | Forest Hills BN, Burnaby North Real Estate | Fraser VE, Vancouver East Real Estate | Fraserview NW, New Westminster Real Estate | Fraserview VE, Vancouver East Real Estate | GDP | Grandview VE, Vancouver East Real Estate | Grandview Woodland, Vancouver East Real Estate | Greentree Village, Burnaby South Real Estate | Hamilton RI, Richmond Real Estate | Hamilton, Richmond Real Estate | Hastings, Vancouver East Real Estate | Highgate, Burnaby South Real Estate | House Marketing | Housing Starts | Interest Rate | Ironwood, Richmond Real Estate | January Newsletter 2022 | January Newsletter 2023 | January Newsletter 2024 | July 2021 Newsletter | July 2022 Newsletter | July 2023 Newsletter | June 2022 Newsletter | June 2023 Newsletter | June 2024 Newsletter | Killarney VE, Vancouver East Real Estate | Kitsilano, Vancouver West Real Estate | Knight, Vancouver East Real Estate | Letter From The Heart | Lions Bay, West Vancouver Real Estate | Lower Lonsdale, North Vancouver Real Estate | Maillardville, Coquitlam Real Estate | Main, Vancouver East Real Estate | March Newsletter 2022 | March Newsletter 2023 | March Newsletter 2024 | May 2022 Newsletter | May 2023 Newsletter | May 2024 Newsletter | Meadow Brook, Coquitlam Real Estate | Metrotown, Burnaby South Real Estate | Mount Pleasant VE, Vancouver East Real Estate | Mount Pleasant VW, Vancouver West Real Estate | New Horizons, Coquitlam Real Estate | Newsletter November 2021 | North Coquitlam, Coquitlam Real Estate | North Vancouver Real Estate | November 2021 Newsletter | November 2022 Newsletter | November 2023 Newsletter | November Newsletter 2021 | October 2021 Newsletter | October 2022 Newsletter | October 2023 Newsletter | Pebble Hill, Tsawwassen Real Estate | Pictures and thoughts to share | Point Grey, Vancouver West Real Estate | Quay, New Westminster Real Estate | Queen Mary Park Surrey, Surrey Real Estate | Queensborough, New Westminster Real Estate | Quilchena, Vancouver West Real Estate | Richmond Real Estate | S.W. Marine, Vancouver West Real Estate | Sapperton, New Westminster Real Estate | September 2021 News | September 2022 Newsletter | September 2023 Newsletter | Silver Valley, Maple Ridge Real Estate | Simon Fraser Univer., Burnaby North Real Estate | Sold listings | South Granville, Vancouver West Real Estate | South Marine, Vancouver East Real Estate | South Slope, Burnaby South Real Estate | South Surrey White Rock Real Estate | Squamish Real Estate | Steveston South, Richmond Real Estate | Sullivan Heights, Burnaby North Real Estate | The Crest, Burnaby East Real Estate | Tsawwassen Central, Tsawwassen Real Estate | University VW, Vancouver West Real Estate | Upper Eagle Ridge, Coquitlam Real Estate | Uptown NW, New Westminster Real Estate | vancouver island Real Estate | Vancouver Real Estate | Victoria VE, Vancouver East Real Estate | Victoria VE, Vancouver West Real Estate | WALL CENTRE FALSE CREEK, Vancouver West Real Estate | West End VW, Vancouver West Real Estate | Westwood Plateau, Coquitlam Real Estate | Whalley, North Surrey Real Estate | Whalley, Surrey Real Estate | Willoughby Heights, Langley Real Estate | Yale - Dogwood Valley, Vancouver West Real Estate | Yaletown, Vancouver West Real Estate | Yel | Yelllow Newsletter July 2022 | Yellow Newletter December 2021 | Yellow Newletter June 2022 | Yellow Newsletter | Yellow Newsletter April 2022 | Yellow Newsletter April 2023 | Yellow Newsletter April 2024 | Yellow Newsletter August 2021 | Yellow Newsletter August 2022 | Yellow Newsletter August 2023 | Yellow Newsletter December 2021 | Yellow Newsletter December 2022 | Yellow Newsletter December 2023 | Yellow Newsletter February 2022 | Yellow Newsletter February 2023 | Yellow Newsletter February 2024 | Yellow Newsletter January 2022 | Yellow Newsletter January 2023 | Yellow Newsletter January 2024 | Yellow Newsletter July 2022 | Yellow Newsletter July 2023 | Yellow Newsletter June 2022 | Yellow Newsletter June 2023 | Yellow Newsletter June 2024 | Yellow Newsletter March 2022 | Yellow Newsletter March 2023 | Yellow Newsletter March 2024 | Yellow Newsletter May 2022 | Yellow Newsletter May 2023 | Yellow Newsletter May 2024 | Yellow Newsletter November 2021 | Yellow Newsletter November 2022 | Yellow Newsletter November 2023 | Yellow Newsletter October 2021 | Yellow Newsletter October 2022 | Yellow Newsletter October 2023 | Yellow Newsletter October, 2021 | Yellow Newsletter September 2021 | Yellow Newsletter September 2022 | Yellow Newsletter September 2023
Reciprocity Logo The data relating to real estate on this website comes in part from the MLS® Reciprocity program of either the Greater Vancouver REALTORS® (GVR), the Fraser Valley Real Estate Board (FVREB) or the Chilliwack and District Real Estate Board (CADREB). Real estate listings held by participating real estate firms are marked with the MLS® logo and detailed information about the listing includes the name of the listing agent. This representation is based in whole or part on data generated by either the GVR, the FVREB or the CADREB which assumes no responsibility for its accuracy. The materials contained on this page may not be reproduced without the express written consent of either the GVR, the FVREB or the CADREB.