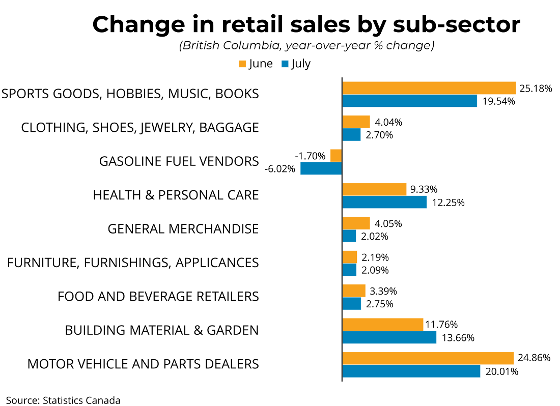
Canadian retail sales decreased by 0.8 per cent to $69.6 billion in July compared to the previous month. Compared to the same time last year, retail sales were up by 4.0 per cent. Furthermore, core retail sales, which exclude gasoline and automobile items, were down 1.2 per cent month-over-month. In volume terms, adjusted for rising prices, retail sales decreased by 0.8 per cent in July.

Retail sales in British Columbia were down 0.8 per cent in July from the previous month and rose by 7.6 per cent compared to the same time last year. In the CMA of Vancouver, retail sales were down 1.6 per cent from the prior month and were 8.9 per cent above the level of July 2024.

July's report contributes to a broader trend of sizeable monthly volatility in Canadian retail sales, with retail activity decreasing in eight out of nine major subsectors compared to June. Moreover, weakness in core retail sales may be indicative of a weakening Canadian labour market and economy as households adapt to a dimmer outlook for the year's final quarter. After cutting the overnight rate earlier this week, the Bank of Canada will monitor how core inflation and growth evolve before forming a policy stance for its meeting in October.

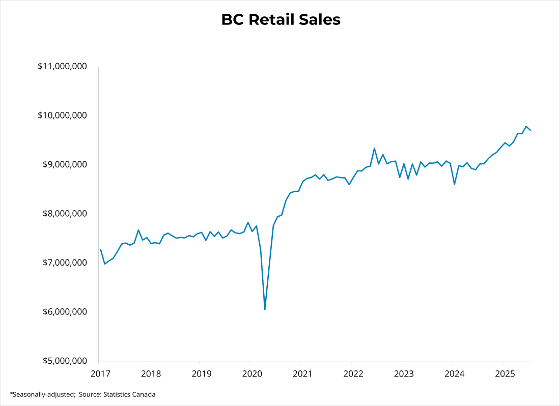
https://mailchi.mp/bcrea/canadian-retail-sales-july-2025

For more information, please contact: Gino Pezzani.


Read

Canadian housing starts decreased 16 per cent from the previous month, totalling 245,791 units in August at a seasonally adjusted annual rate (SAAR). Starts were up 15 per cent from the same month last year. Single-detached housing starts decreased by 2 per cent from last month to 55,271 units, while multi-family and other starts decreased by 20 per cent to 190,519 units (SAAR).

In British Columbia, starts fell by 19 per cent from last month to 46,274 units (SAAR) in all areas of the province. In areas of the province with 10,000 or more residents, single-detached starts increased by 7 per cent to 4,284 units, while multi-family starts fell by 22 per cent to 39,480 units month-over-monthStarts in the province were 34 per cent above the levels from August 2024. Year-to-date starts are up 150 per cent in Abbotsford and 31 per cent in Victoria, but down 56 per cent in Nanaimo, 37 per cent in Kelowna, and 0.6 per cent in Vancouver.

For more information, please contact: Gino Pezzani.


Read

Canadian prices, as measured by the Consumer Price Index (CPI), rose 1.9 per cent on a year-over-year basis in August, up from a 1.7 per cent increase in July. Month-over-month, on a seasonally adjusted basis, the CPI was up 0.2 per cent in August. The CPI ex-gasoline increased by 2.4 per cent in August after holding at 2.5 per cent during each of the previous three months.  Additionally, shelter price growth was 2.6 per cent in August, the smallest year-over-year increase since March 2021, and down from 3.0 per cent in July. Food price growth registered at 3.4 per cent year-over-year, marginally higher than the previous month. In BC, consumer prices rose 1.8 per cent year-over-year in August, up from 1.7 per cent in July. The Bank of Canada's preferred measures of median and trimmed inflation, which strip out volatile components, remained at 3.1 per cent and 3.0 per cent year-over-year, respectively.

While the Bank of Canada's core measures of inflation have remained at the upper end—and even outside of—their target range, 3-month annualized core inflation has stabilized around 2.5 per cent. Coupled with weaker-than-expected second-quarter growth, this report is unlikely to sway the Bank of Canada away from a likely rate cut tomorrow in hopes of stimulating the economy heading into the final quarter of the year.

https://mailchi.mp/bcrea/canadian-inflation-august-2025

For more information, please contact: Gino Pezzani.

Read

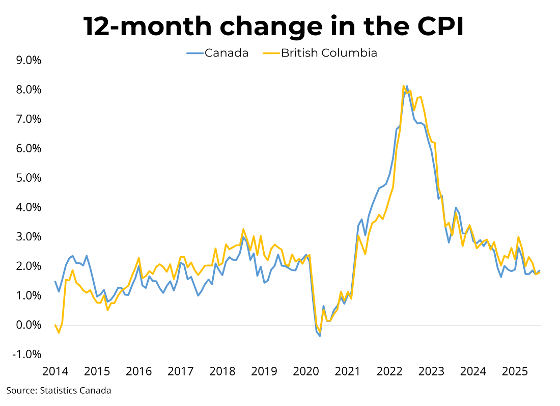
The Bank of Canada lowered its overnight policy rate to 2.5 per cent this morning. In its statement, the Bank noted that US tariffs sharply impacted Canadian export levels while also hindering business investment. In spite of resilient consumer spending, GDP declined by about 1.5% in the second quarter, aligning with the Bank's most recent projection. In addition, the Canadian labour market has cooled further through the summer, with the national unemployment rate reaching 7.1 per cent, its highest level since May 2016, excluding the pandemic. Regarding inflation, the Bank noted that the upward pressure on month-over-month core inflation growth is dissipating, which, coupled with the de-escalatory behaviour from our government, reduces the overall inflationary risks associated with trade policy moving forward.

Taken together, the Bank of Canada signalled a tangible shift in policy rate considerations, emphasizing weak economic growth in conjunction with stabilized inflation as a backdrop to lower rates. However, the Bank expressed continued caution and vigilance regarding its outlook due to the lingering uncertainties associated with US tariffs and their risks to Canada's export potential. Financial markets are now shifting attention towards what the Bank will do before the end of the year, with many economists believing that tempered inflation and prolonged weakness in the economy will result in an additional 25-point cut, bringing the policy rate to 2.25% by year-end. These expectations are reflected in 5-year bond yields, which have stabilized around 2.71%, down about 0.4 points from their summer peak.  This broader trend will place downward pressure on 5-year fixed mortgage rates, which we hope stimulates stronger sales activity to close out a weak year in the housing market overall.

For more information, please contact: Gino Pezzani.

Read

For the complete news release, including detailed statistics, click here.

Vancouver, BC – September 2025 The British Columbia Real Estate Association (BCREA) reports that 5,961 residential unit sales were recorded in Multiple Listing Service® (MLS®) Systems in August 2025, up 0.5 per cent from August 2024. The average MLS® residential price in BC in August 2025 was down 1.4 per cent at $926,335 compared to $939,376 in August 2024.

The total sales dollar volume was $5.5 billion, down 0.9 per cent from the same time the previous year. BC MLS® unit sales were 24.2 per cent lower than the ten-year August average.

“We continue to see significant regional disparity in the market, with the Lower Mainland lagging behind the rest of the province,” said BCREA Chief Economist Brendon Ogmundson. “While sales finished the summer on a lower note than expected, we continue to see encouraging signs of a better second half of the year.”

Year-to-date, BC residential sales dollar volume is down 8.5 per cent to $46.3 billion, compared with the same period in 2024. Residential unit sales are down 5 per cent year-over-year at 48,842 units, while the average MLS
® residential price is also down 3.7 per cent to $949,157.

For more information, please contact: Gino Pezzani.


Read
Categories:   Albion, Maple Ridge Real Estate | April 2023 Newsletter | April 2024 Newsletter | April 2025 Newsletter | April Newsletter 2022 | Arbutus, Vancouver West Real Estate | August 2021 News | August 2022 Newsletter | August 2023 Newsletters | August 2024 Newsletter | August 2025 Newsletter | Bank | Blueridge NV, North Vancouver Real Estate | Brentwood Park, Burnaby North Real Estate | Brighouse South, Richmond Real Estate | Brighouse, Richmond Real Estate | British Properties, West Vancouver Real Estate | Burke Mountain, Coquitlam Real Estate | Burnaby Lake, Burnaby South Real Estate | Cambie, Vancouver West Real Estate | Canadian Employment | Canadian Inflation | Canyon Heights NV, North Vancouver Real Estate | Canyon Springs, Coquitlam Real Estate | Capitol Hill BN, Burnaby North Real Estate | Central Lonsdale, North Vancouver Real Estate | Central Park BS, Burnaby South Real Estate | Champlain Heights, Vancouver East Real Estate | Citadel PQ, Port Coquitlam Real Estate | Cloverdale BC, Cloverdale Real Estate | Coal Harbour, Vancouver West Real Estate | Collingwood VE, Vancouver East Real Estate | Coquitlam West, Coquitlam Real Estate | COVID-19 Recovery Dashboard | December 2021 Newsletter | December 2022 Newsletter | December 2023 Newsletter | December 2024 Newsletter | Delta Manor, Ladner Real Estate | Downtown NW, New Westminster Real Estate | Downtown VW, Vancouver West Real Estate | Downtown, Vancouver West Real Estate | Dunbar, Vancouver West Real Estate | Eagle Harbour, West Vancouver Real Estate | East Burnaby, Burnaby East Real Estate | East Newton, Surrey Real Estate | East Richmond, Richmond Real Estate | Fairview VW, Vancouver West Real Estate | False Creek, Vancouver West Real Estate | February Newsletter 2022 | February Newsletter 2023 | February Newsletter 2024 | February Newsletter 2025 | Forest Hills BN, Burnaby North Real Estate | Fraser VE, Vancouver East Real Estate | Fraserview NW, New Westminster Real Estate | Fraserview VE, Vancouver East Real Estate | GDP | Grandview VE, Vancouver East Real Estate | Grandview Woodland, Vancouver East Real Estate | Greentree Village, Burnaby South Real Estate | Hamilton RI, Richmond Real Estate | Hamilton, Richmond Real Estate | Hastings, Vancouver East Real Estate | Highgate, Burnaby South Real Estate | House Marketing | Housing Starts | Interest Rate | Ironwood, Richmond Real Estate | January Newsletter 2022 | January Newsletter 2023 | January Newsletter 2024 | January Newsletter 2025 | July 2021 Newsletter | July 2022 Newsletter | July 2023 Newsletter | July 2024 Newsletter | July 2025 Newsletter | June 2022 Newsletter | June 2023 Newsletter | June 2024 Newsletter | June 2025 Newsletter | Killarney VE, Vancouver East Real Estate | Kitsilano, Vancouver West Real Estate | Knight, Vancouver East Real Estate | Letter From The Heart | Lions Bay, West Vancouver Real Estate | Lower Lonsdale, North Vancouver Real Estate | Maillardville, Coquitlam Real Estate | Main, Vancouver East Real Estate | March Newsletter 2022 | March Newsletter 2023 | March Newsletter 2024 | March Newsletter 2025 | May 2022 Newsletter | May 2023 Newsletter | May 2024 Newsletter | May 2025 Newsletter | Meadow Brook, Coquitlam Real Estate | Metrotown, Burnaby South Real Estate | Mount Pleasant VE, Vancouver East Real Estate | Mount Pleasant VW, Vancouver West Real Estate | New Horizons, Coquitlam Real Estate | Newsletter November 2021 | North Coquitlam, Coquitlam Real Estate | North Vancouver Real Estate | November 2021 Newsletter | November 2022 Newsletter | November 2023 Newsletter | November 2024 Newsletter | November Newsletter 2021 | October 2021 Newsletter | October 2022 Newsletter | October 2023 Newsletter | October 2024 Newsletter | Pebble Hill, Tsawwassen Real Estate | Pictures and thoughts to share | Point Grey, Vancouver West Real Estate | Quay, New Westminster Real Estate | Queen Mary Park Surrey, Surrey Real Estate | Queensborough, New Westminster Real Estate | Quilchena, Vancouver West Real Estate | Richmond Real Estate | S.W. Marine, Vancouver West Real Estate | Sapperton, New Westminster Real Estate | September 2021 News | September 2022 Newsletter | September 2023 Newsletter | September 2024 Newsletters | september 2025 Newsletter | Silver Valley, Maple Ridge Real Estate | Simon Fraser Univer., Burnaby North Real Estate | Sold listings | South Granville, Vancouver West Real Estate | South Marine, Vancouver East Real Estate | South Slope, Burnaby South Real Estate | South Surrey White Rock Real Estate | Squamish Real Estate | Steveston South, Richmond Real Estate | Sullivan Heights, Burnaby North Real Estate | The Crest, Burnaby East Real Estate | Tsawwassen Central, Tsawwassen Real Estate | University VW, Vancouver West Real Estate | Upper Eagle Ridge, Coquitlam Real Estate | Uptown NW, New Westminster Real Estate | vancouver island Real Estate | Vancouver Real Estate | Victoria VE, Vancouver East Real Estate | Victoria VE, Vancouver West Real Estate | WALL CENTRE FALSE CREEK, Vancouver West Real Estate | West End VW, Vancouver West Real Estate | Westwood Plateau, Coquitlam Real Estate | Whalley, North Surrey Real Estate | Whalley, Surrey Real Estate | Willoughby Heights, Langley Real Estate | Yale - Dogwood Valley, Vancouver West Real Estate | Yaletown, Vancouver West Real Estate | Yel | Yelllow Newsletter July 2022 | Yellow Newletter December 2021 | Yellow Newletter June 2022 | Yellow Newsletter | Yellow Newsletter April 2022 | Yellow Newsletter April 2023 | Yellow Newsletter April 2024 | Yellow Newsletter April 2025 | Yellow Newsletter August 2021 | Yellow Newsletter August 2022 | Yellow Newsletter August 2023 | Yellow Newsletter August 2024 | Yellow Newsletter August 2025 | Yellow Newsletter December 2021 | Yellow Newsletter December 2022 | Yellow Newsletter December 2023 | Yellow Newsletter December 2024 | Yellow Newsletter February 2022 | Yellow Newsletter February 2023 | Yellow Newsletter February 2024 | Yellow Newsletter February 2025 | Yellow Newsletter January 2022 | Yellow Newsletter January 2023 | Yellow Newsletter January 2024 | Yellow Newsletter January 2025 | Yellow Newsletter July 2022 | Yellow Newsletter July 2023 | Yellow Newsletter July 2024 | Yellow Newsletter July 2025 | Yellow Newsletter June 2022 | Yellow Newsletter June 2023 | Yellow Newsletter June 2024 | Yellow Newsletter June 2025 | Yellow Newsletter March 2022 | Yellow Newsletter March 2023 | Yellow Newsletter March 2024 | Yellow Newsletter March 2025 | Yellow Newsletter May 2022 | Yellow Newsletter May 2023 | Yellow Newsletter May 2024 | Yellow Newsletter May 2025 | Yellow Newsletter November 2021 | Yellow Newsletter November 2022 | Yellow Newsletter November 2023 | Yellow Newsletter November 2024 | Yellow Newsletter October 2021 | Yellow Newsletter October 2022 | Yellow Newsletter October 2023 | Yellow Newsletter October 2024 | Yellow Newsletter October, 2021 | Yellow Newsletter September 2021 | Yellow Newsletter September 2022 | Yellow Newsletter September 2023 | Yellow Newsletter September 2024 | Yellow Newsletter September 2025
Reciprocity Logo The data relating to real estate on this website comes in part from the MLS® Reciprocity program of either the Greater Vancouver REALTORS® (GVR), the Fraser Valley Real Estate Board (FVREB) or the Chilliwack and District Real Estate Board (CADREB). Real estate listings held by participating real estate firms are marked with the MLS® logo and detailed information about the listing includes the name of the listing agent. This representation is based in whole or part on data generated by either the GVR, the FVREB or the CADREB which assumes no responsibility for its accuracy. The materials contained on this page may not be reproduced without the express written consent of either the GVR, the FVREB or the CADREB.